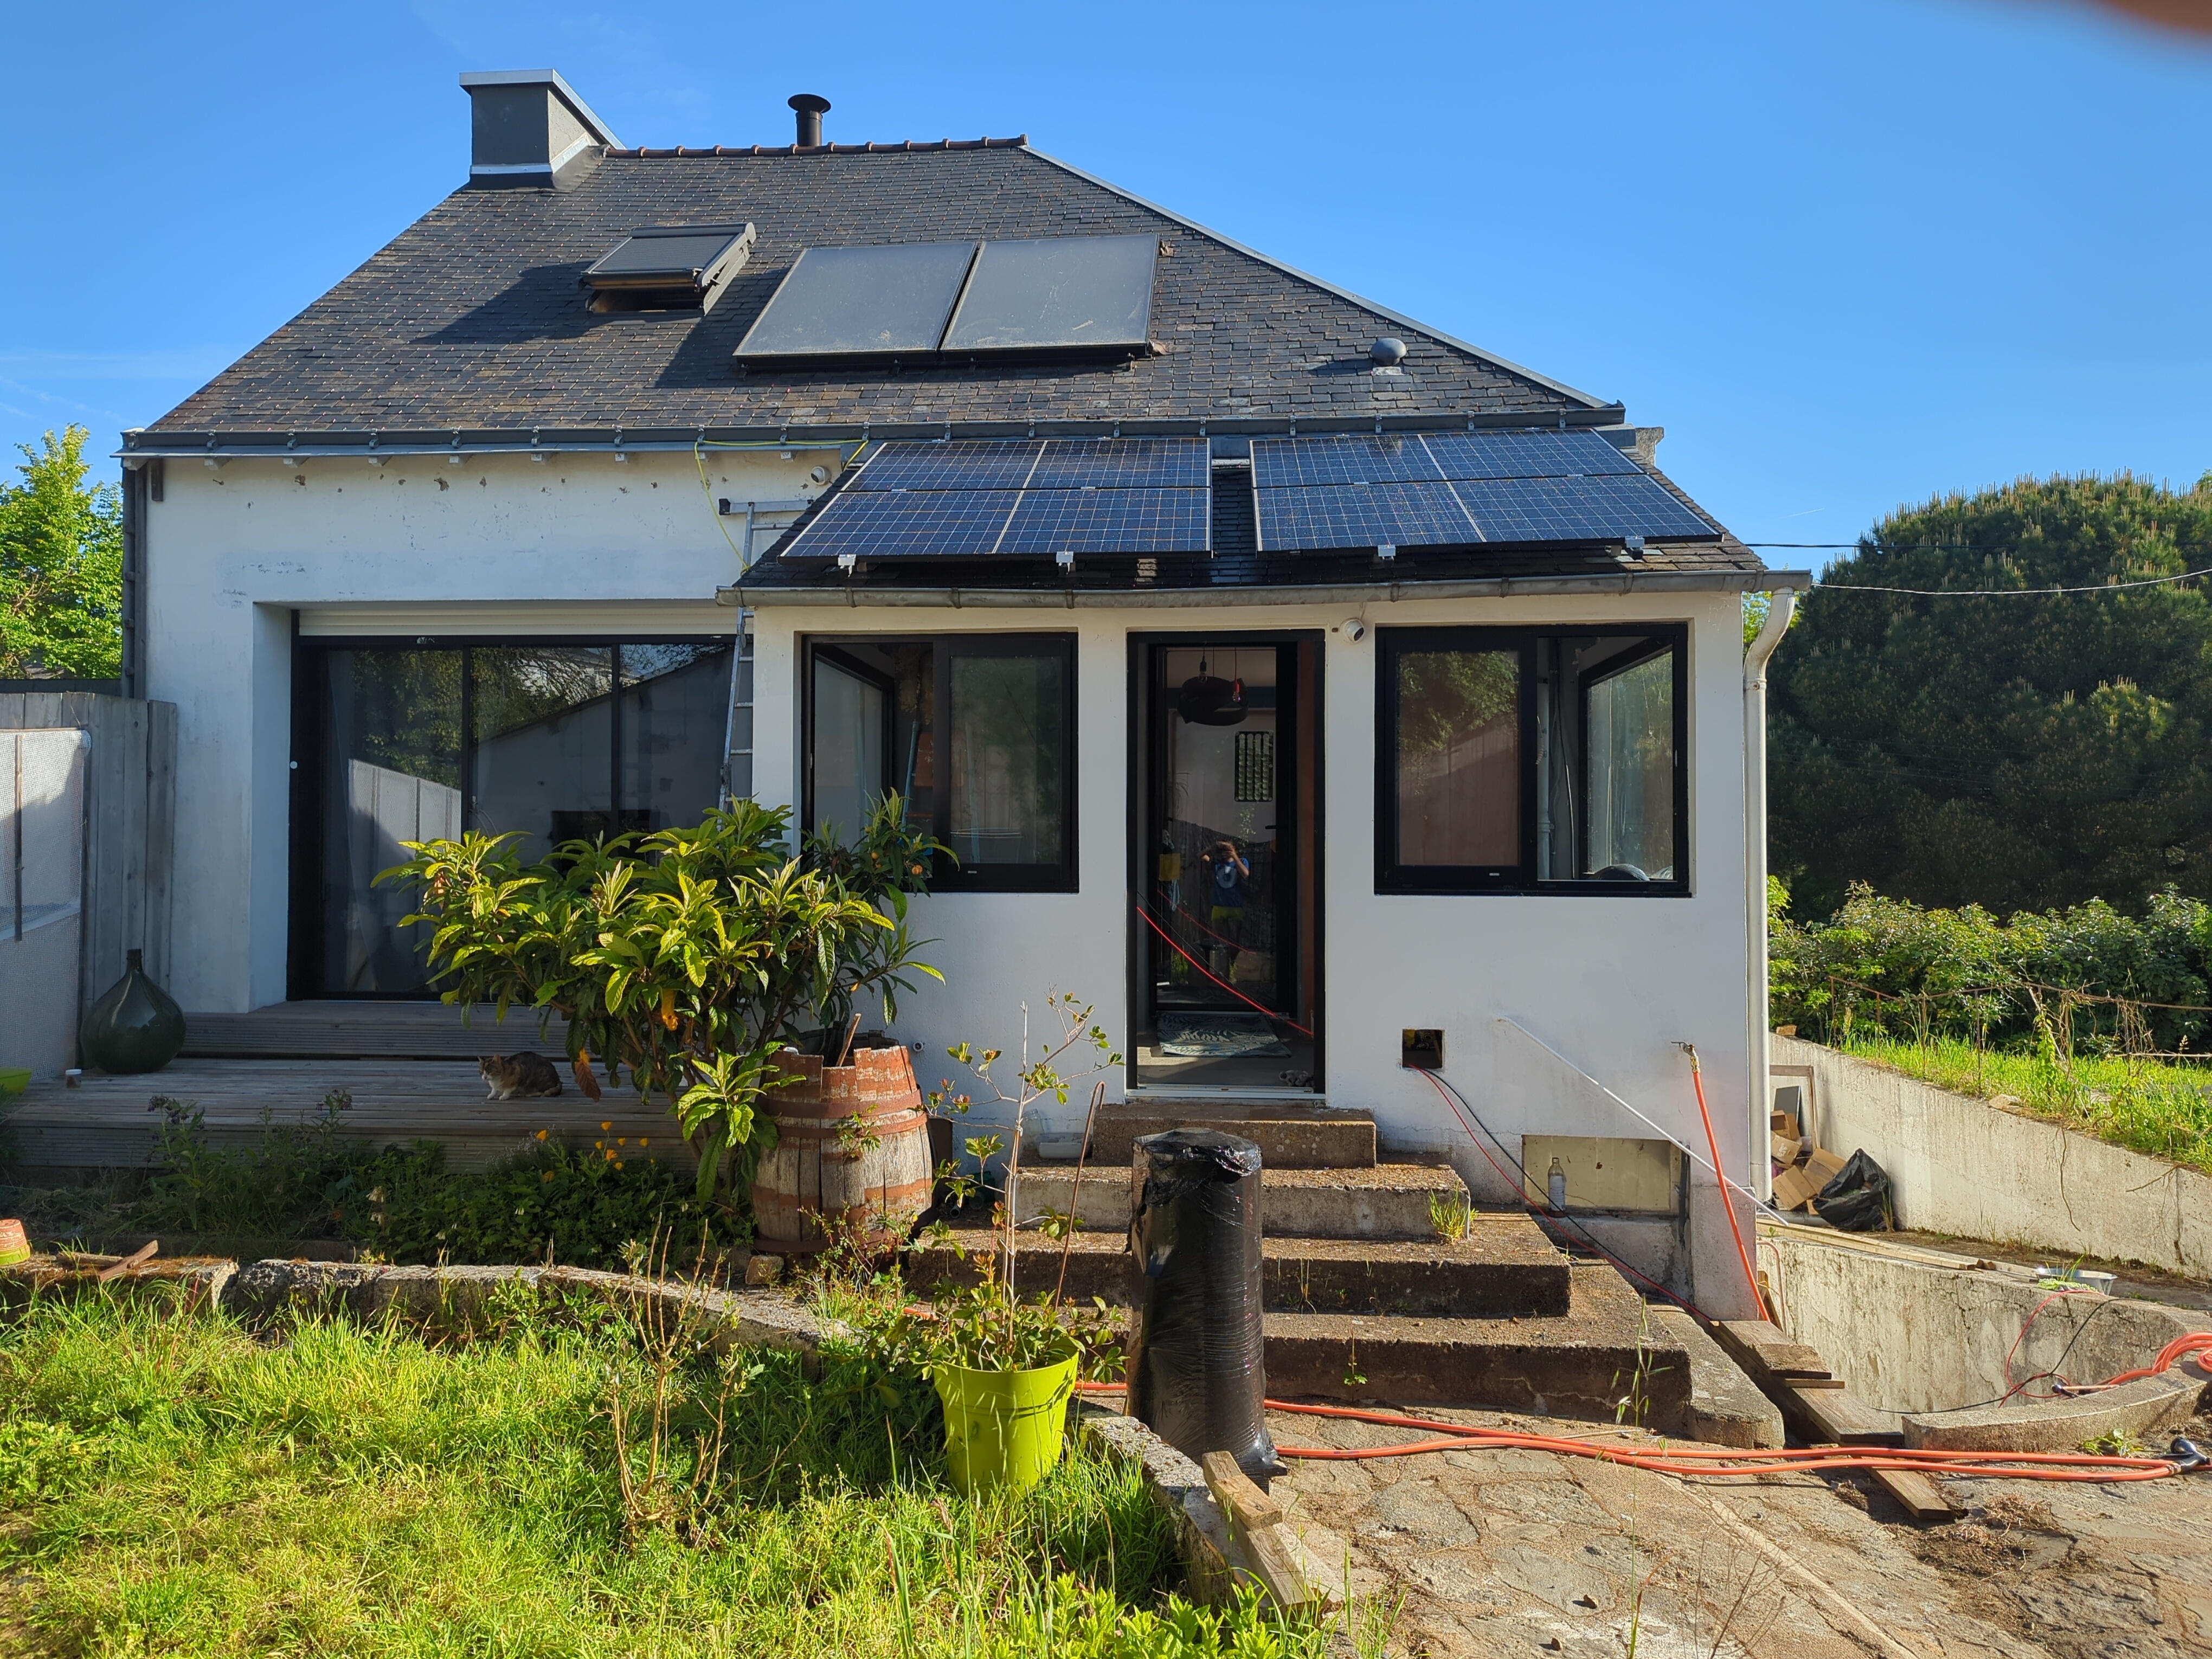
House's solar and monitoring system
Here are the specs :
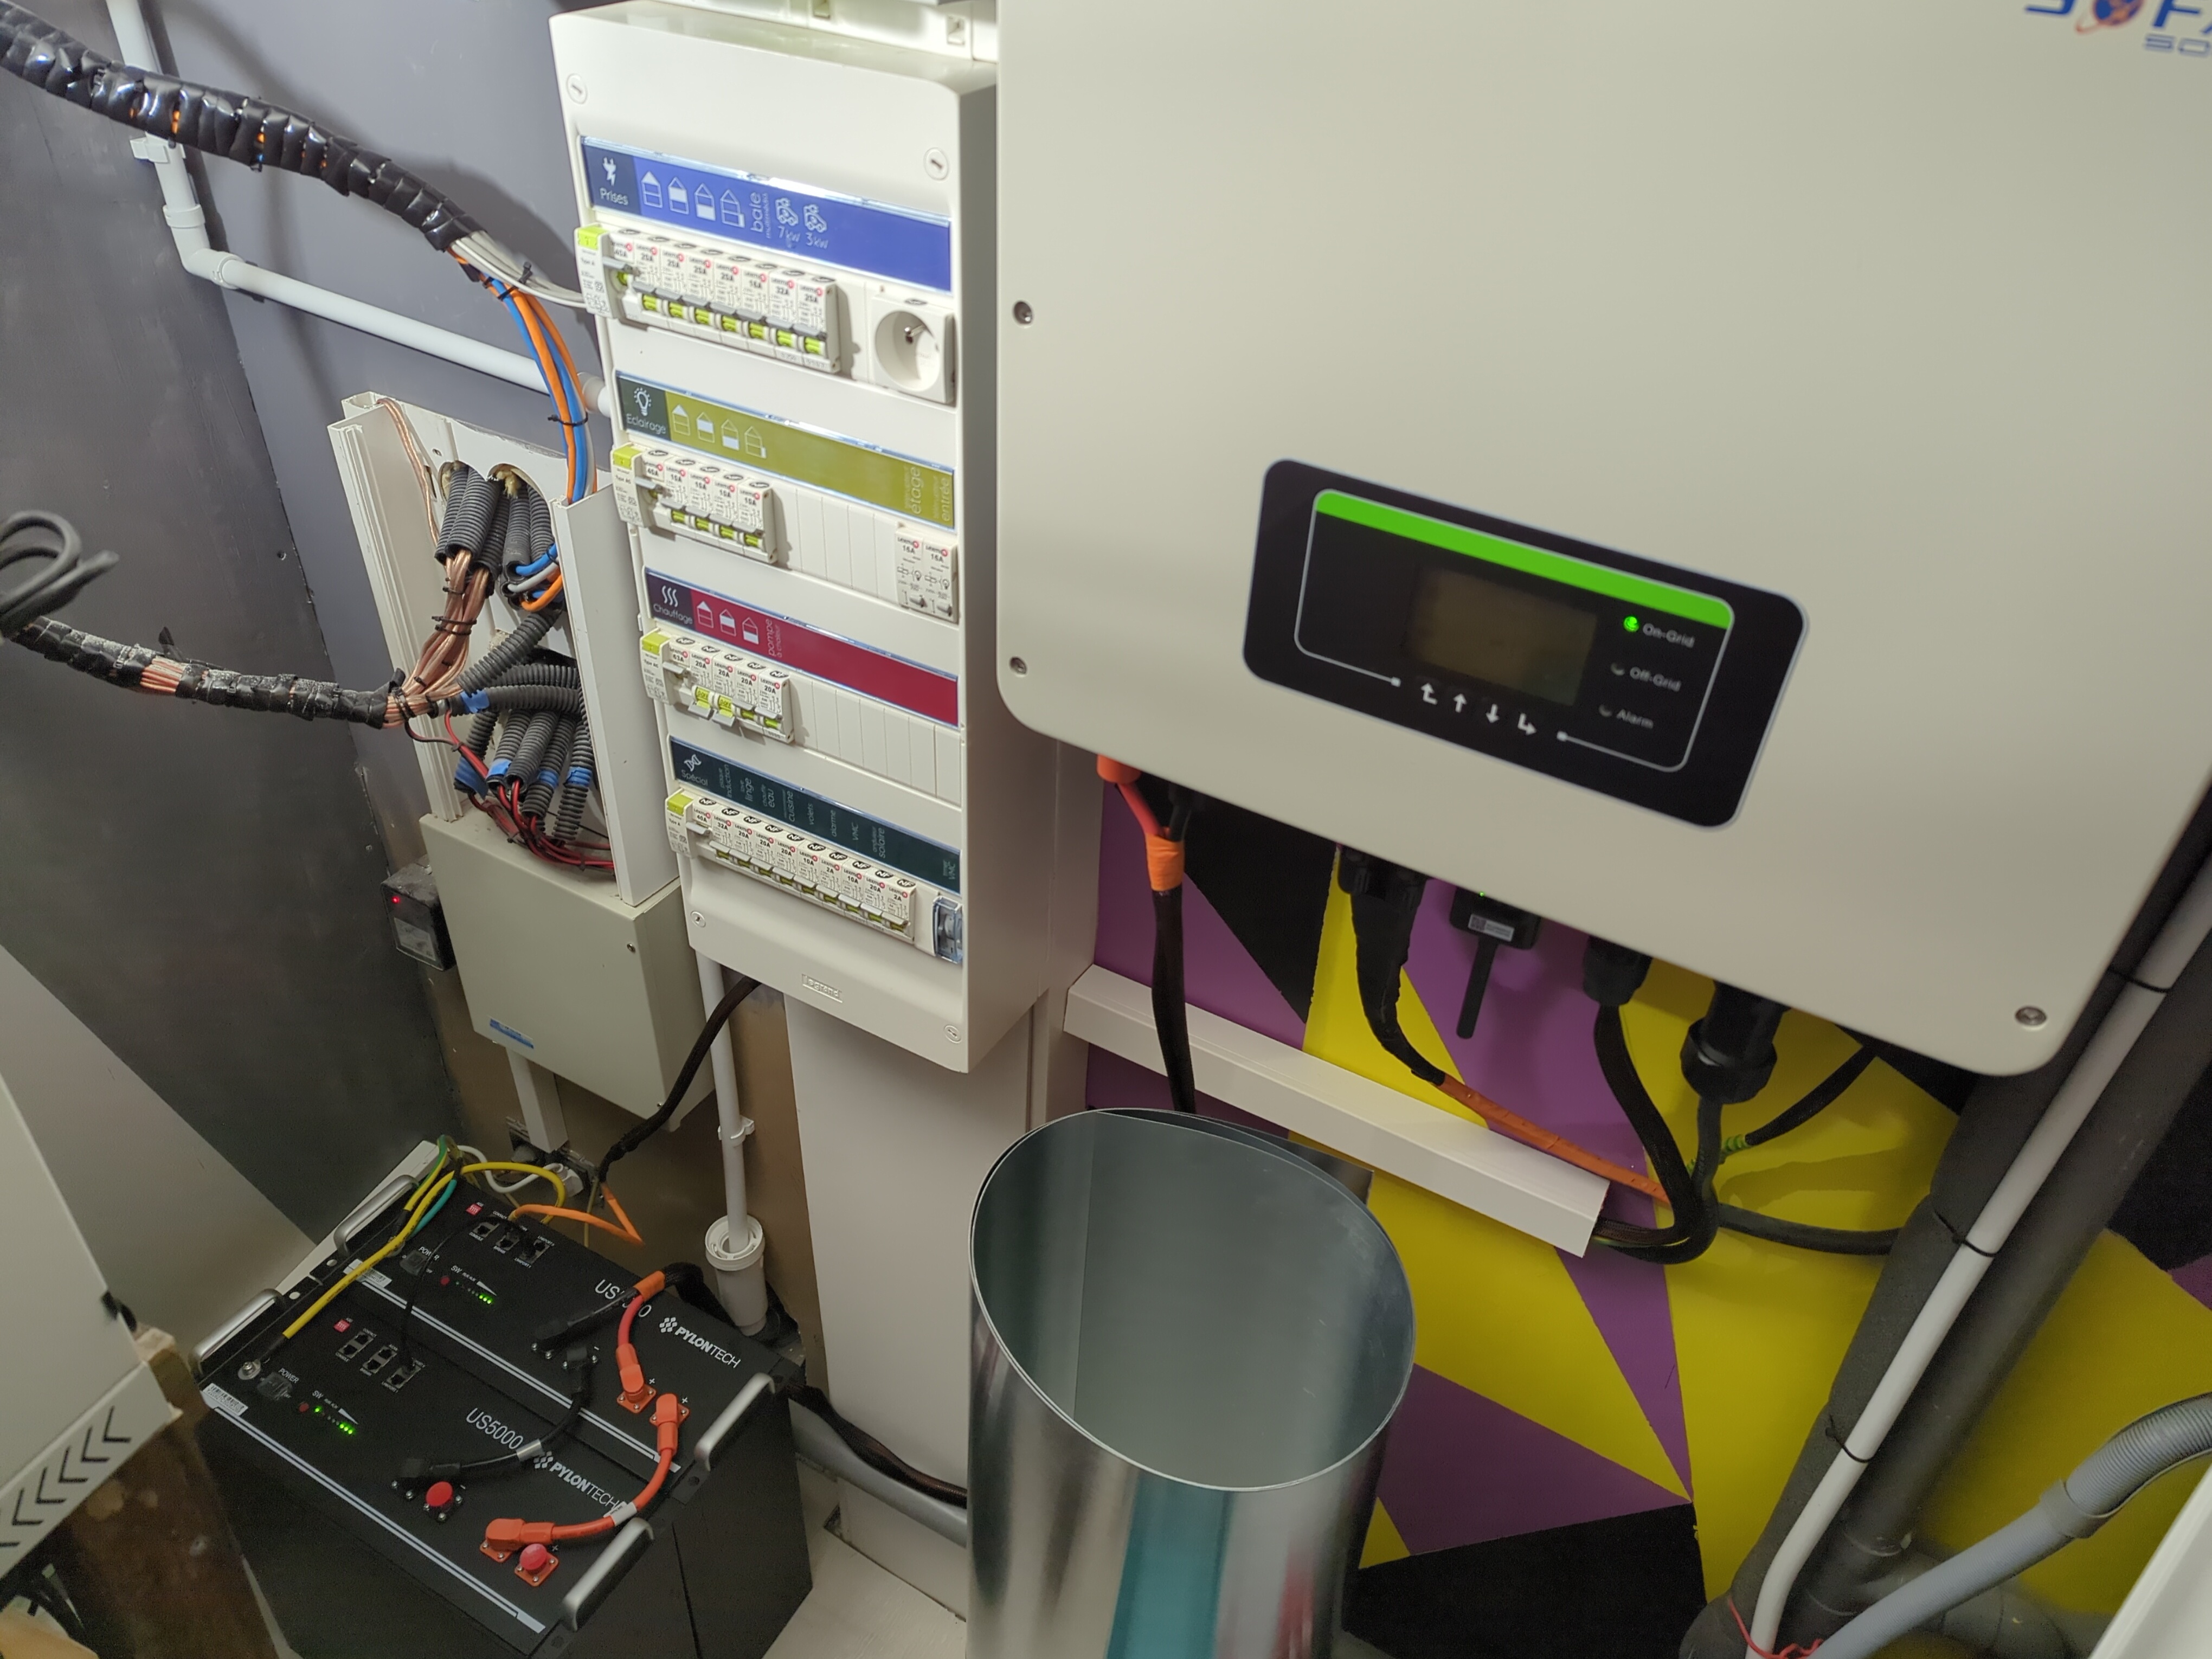
- Sofar Solar HYD-3000-EP (4.5kWc/3kW AC inverter)
- 2x Pylontech US5000 (9.6kWh, about 8kWh net usable with 20% safety buffer)
- 4x Trina Solar 435W 144 cells
- 6x Trina Soalr 400W 120 cells
Monitoring is done via Home Assistant running in a Docker container, itself running in an LXC container on Proxmox. Most sensors communicate in zigbee, including the Linky via a tiny self-powered module. To communicate with the solar inverter, a Solarman Integration via Wifi is used.
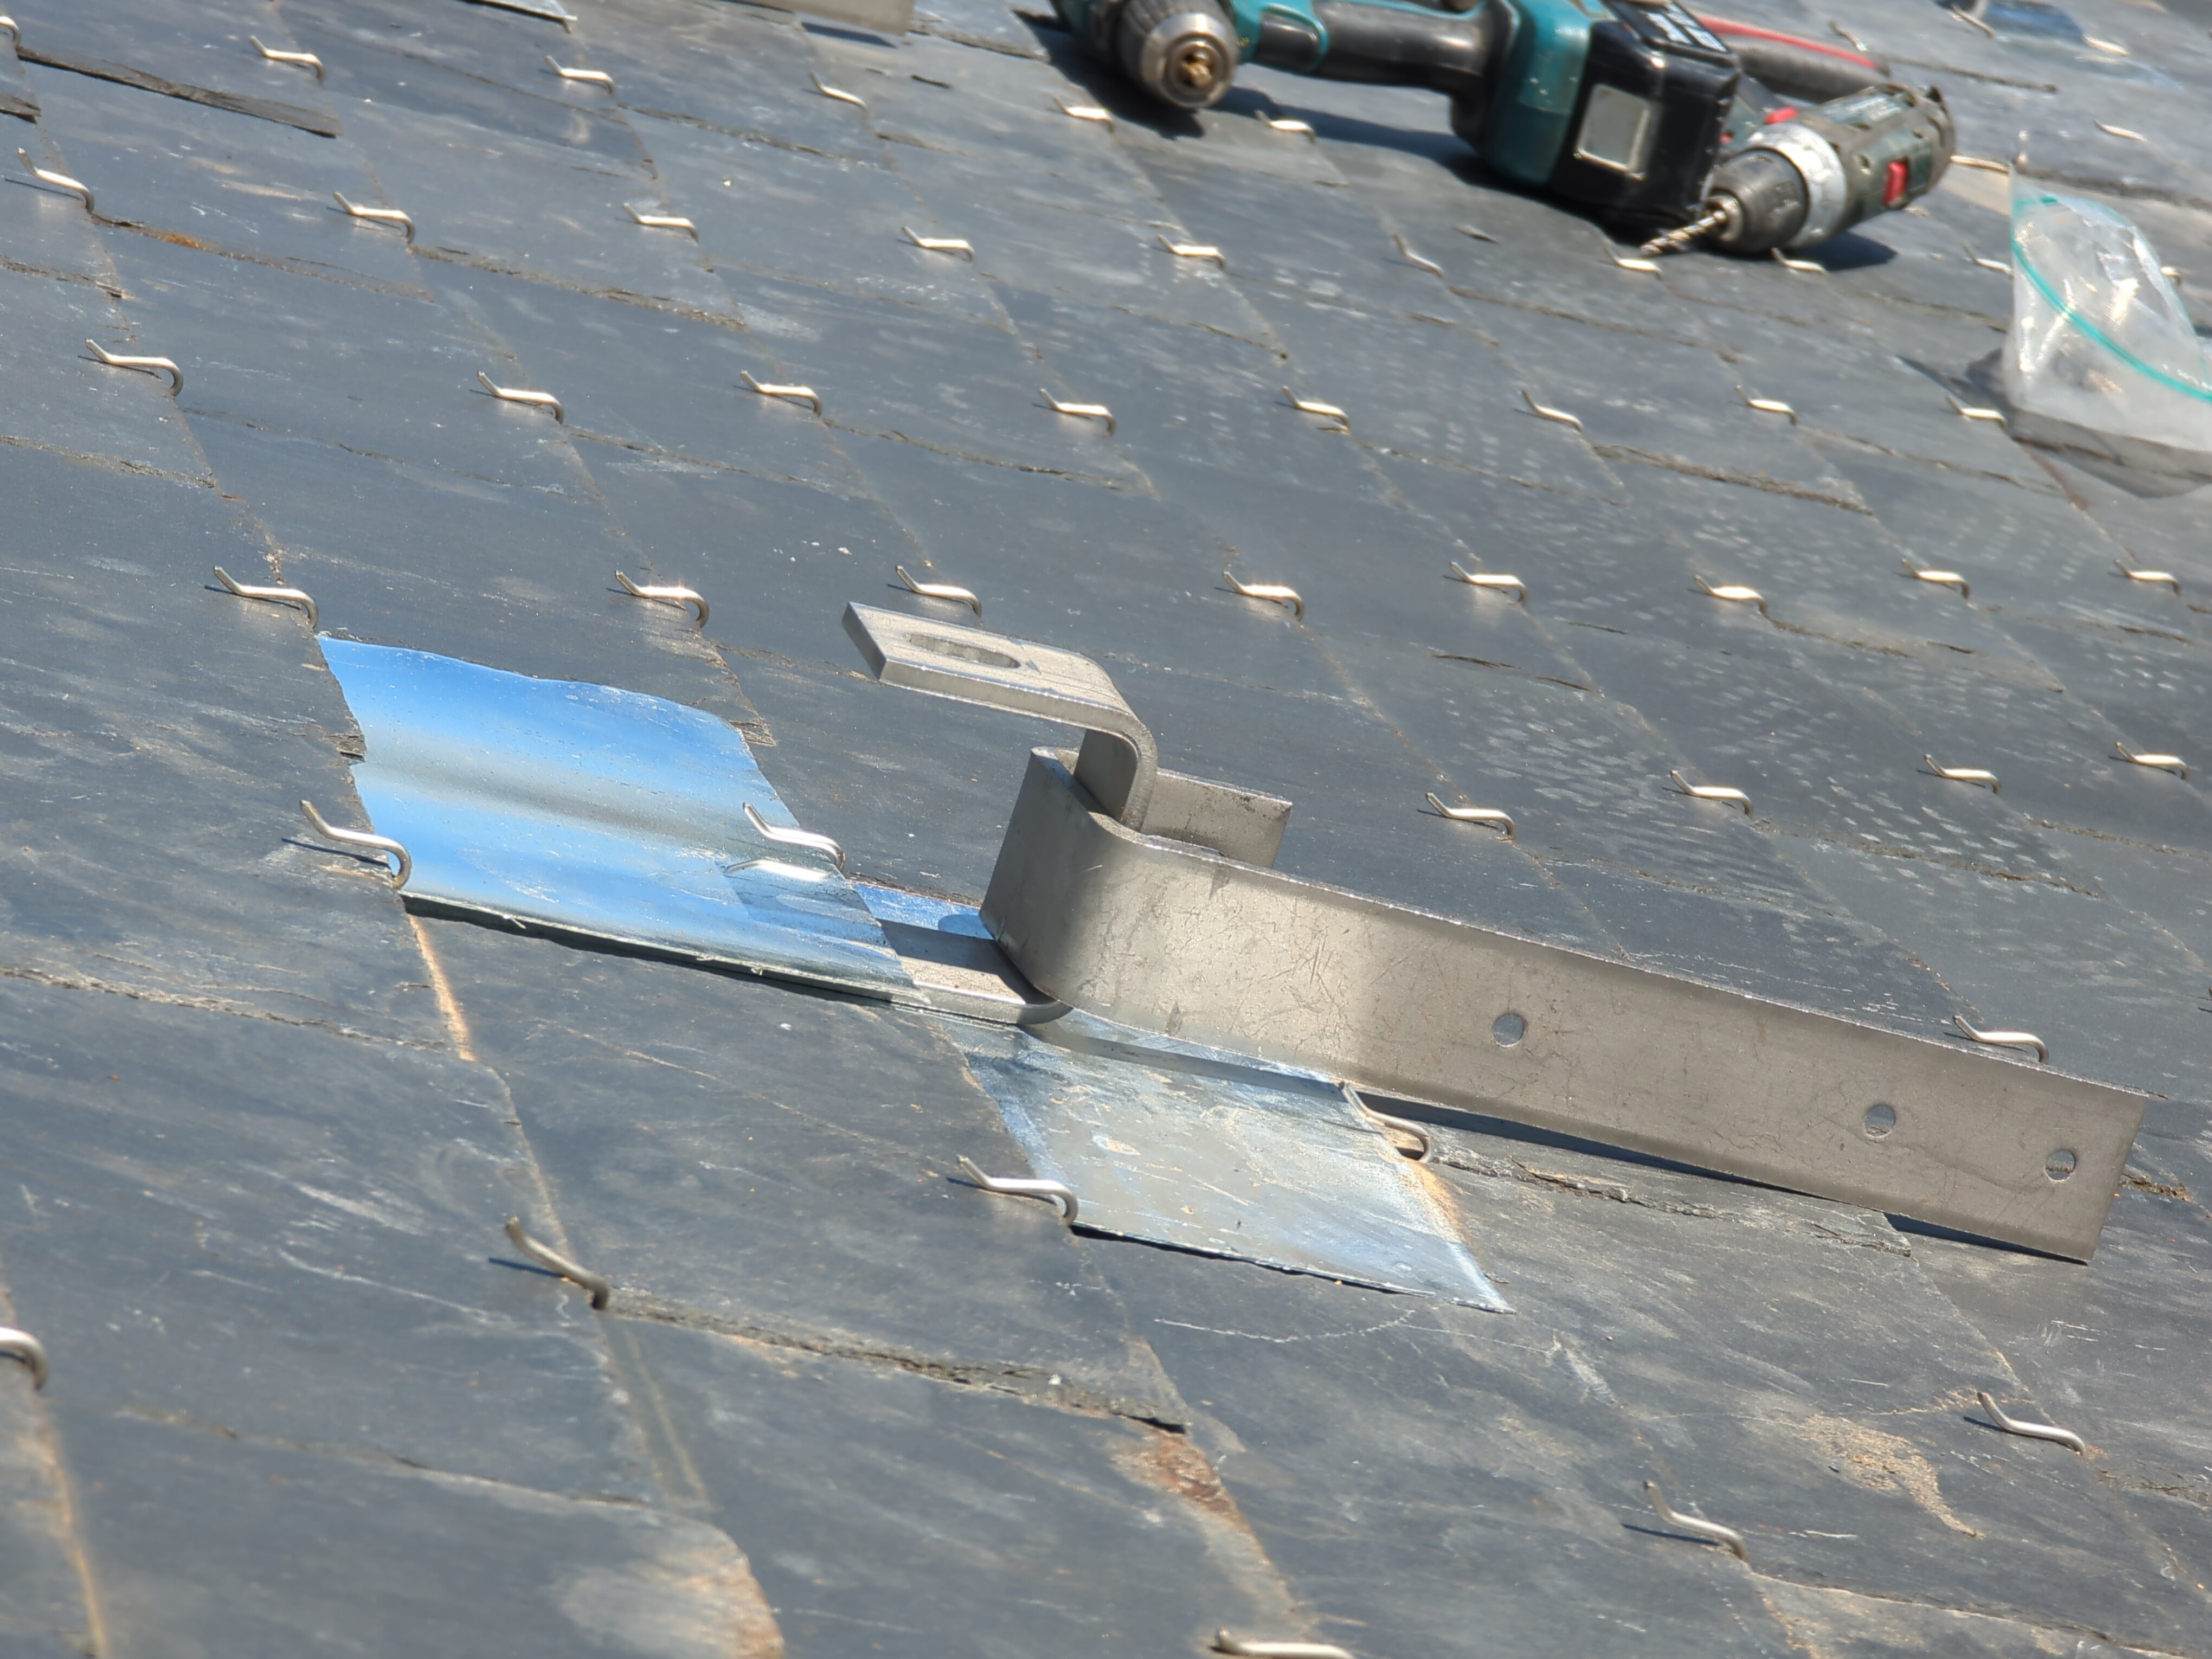
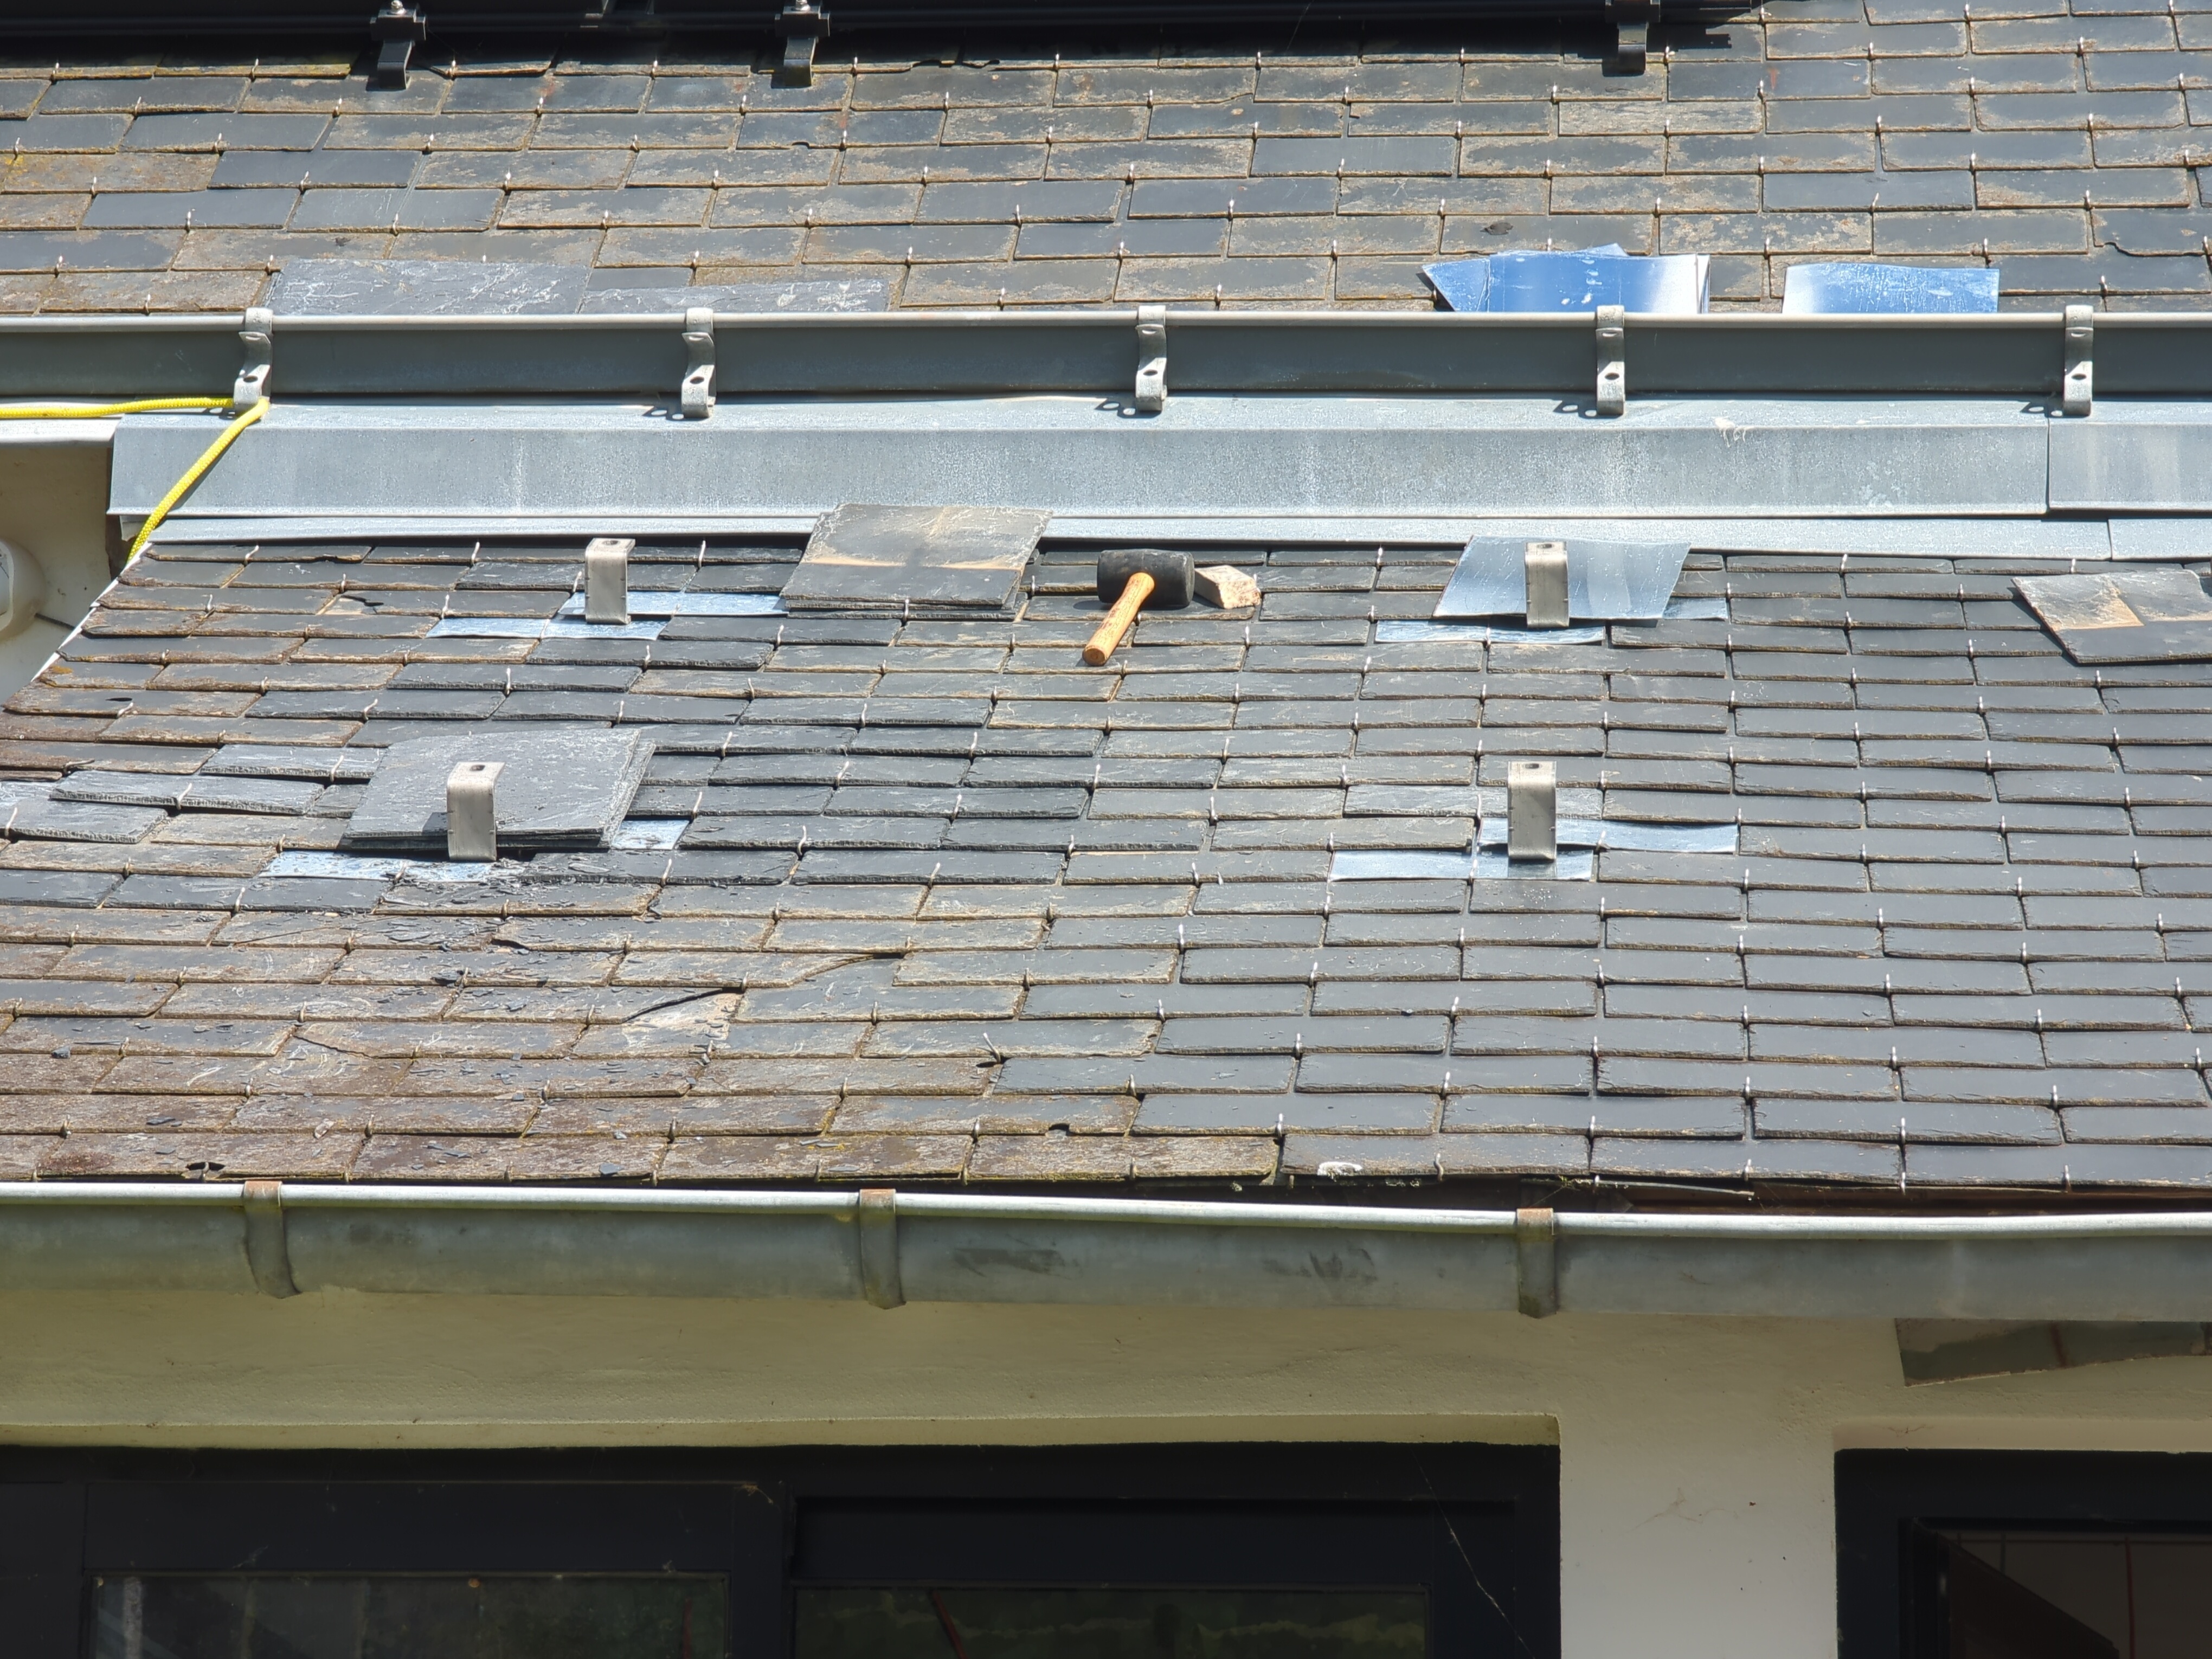
The first 4x 435W string is installed on the roof, but the 6x 400W are still on the ground for now, as the hardest part is climbing on the roof with large fragile objects of 20 Kg each and not braking anything or falling 5m lower to the ground.
We have reached ~100% self sufficiency since April 2024. Meaning it powers 100% of the house, and is able to charge the car/motorcycle. Although, I must charge the car slowly (2.4kW instead of its 7kW internal charger rating, as our inverter cannot provide more than 3kW).
Charging the car is sometimes a bit of a logistical challenge, especially since the car must be parked in front of the house on a public road during charging. Which precludes from charging at night due to the risks of vandalism in my neighbourhood.
In winter I don't bother and go full-send at 7kW so that it charges quickly. We don't produce enough solar electricity for the house at that season anyways.
As you'll see in the following screenshot (from Home Assistant), we are still drawing from the grid, due to a small and permanent 80W offset on the current transformer used by the inverter. I have very recently hacked my way around it, by adding a circuit that draws 80W continously in the CT (The IT & Audio bay). Hence the last 7 days without anything drawn from he grid.
And here are the main source of consumption.
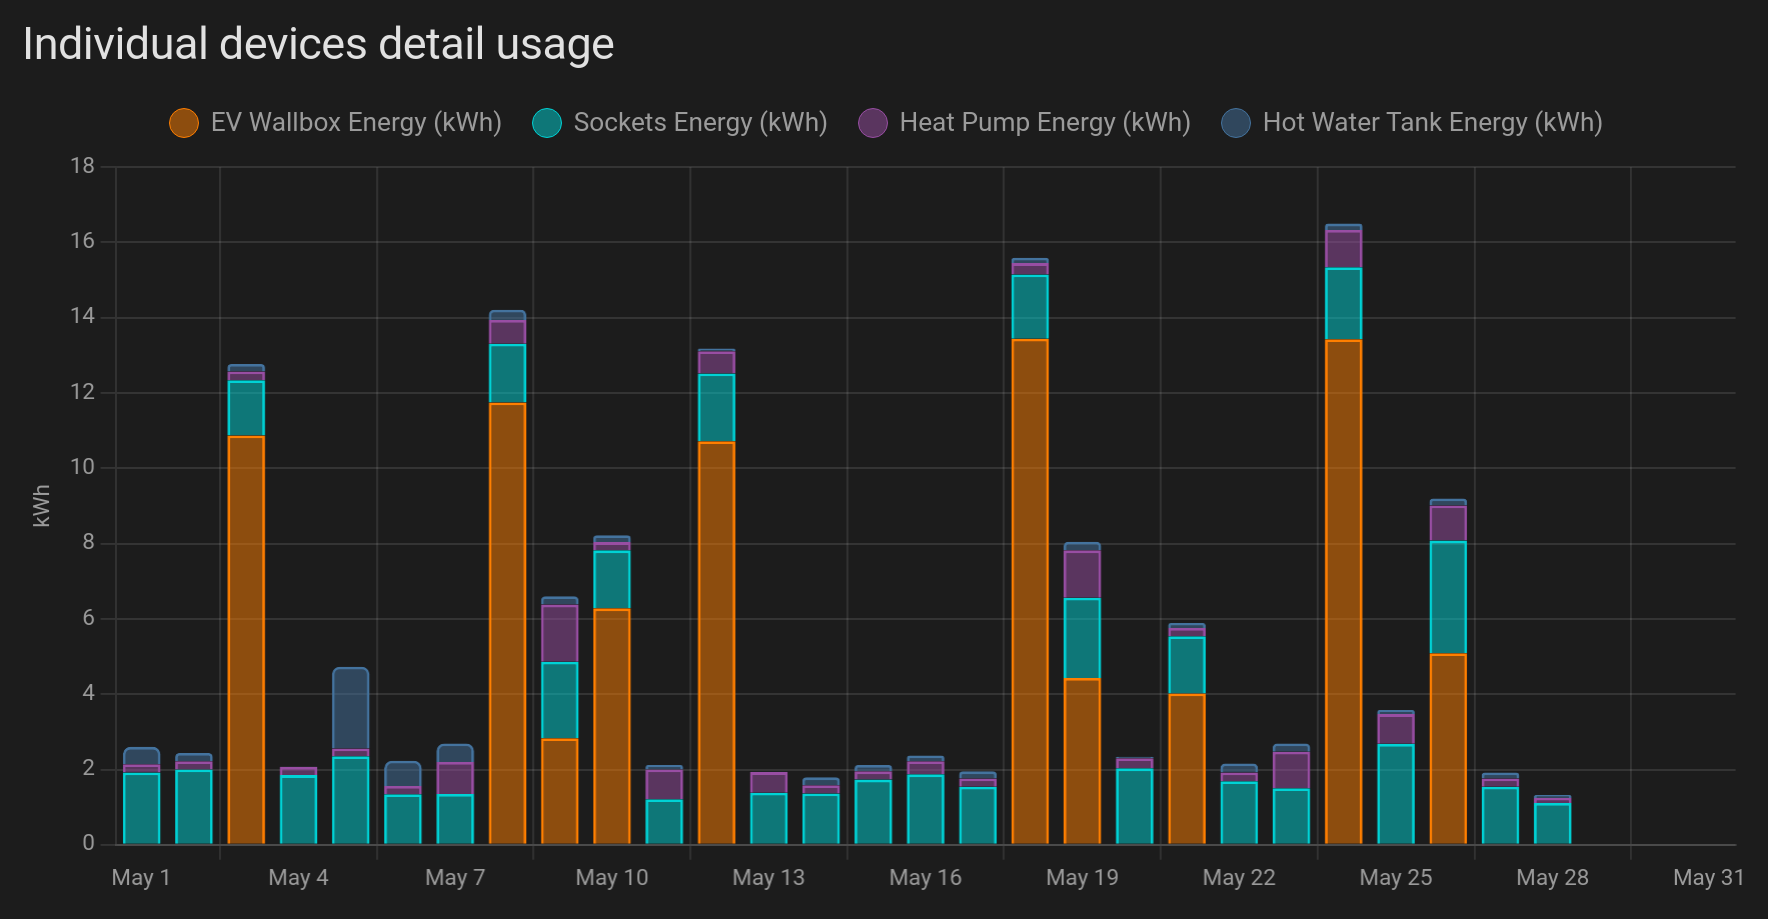
The hot water tank almost never has to use any electricity between the months of March and October. The thermal solar panels are providing enough heat to keep the water warm. We can also see some heatpump consumption, this is cooling for my baby's bedroom.
Not directly monitored by Home Assistant (but still included in the total consumption) are
- the dishwasher, which is supplied with hot water from the hot water tank (which is itself heated by thermal solar panels).
- the washing machine, which is also supplied with hot water. Although I can choose to use hot or cold water. When the tank is not very hot but the batteries are fully charged this is preferable. Typically following three days without sun but with a bright cloudy sky, photovoltaic copes much better than thermal solar with this situations.
- kitchen appliances, including the refregirator
- double flow mechanical ventillation, which draws about 30W and doesn't run during rush-hour in our street due to pollution concerns.
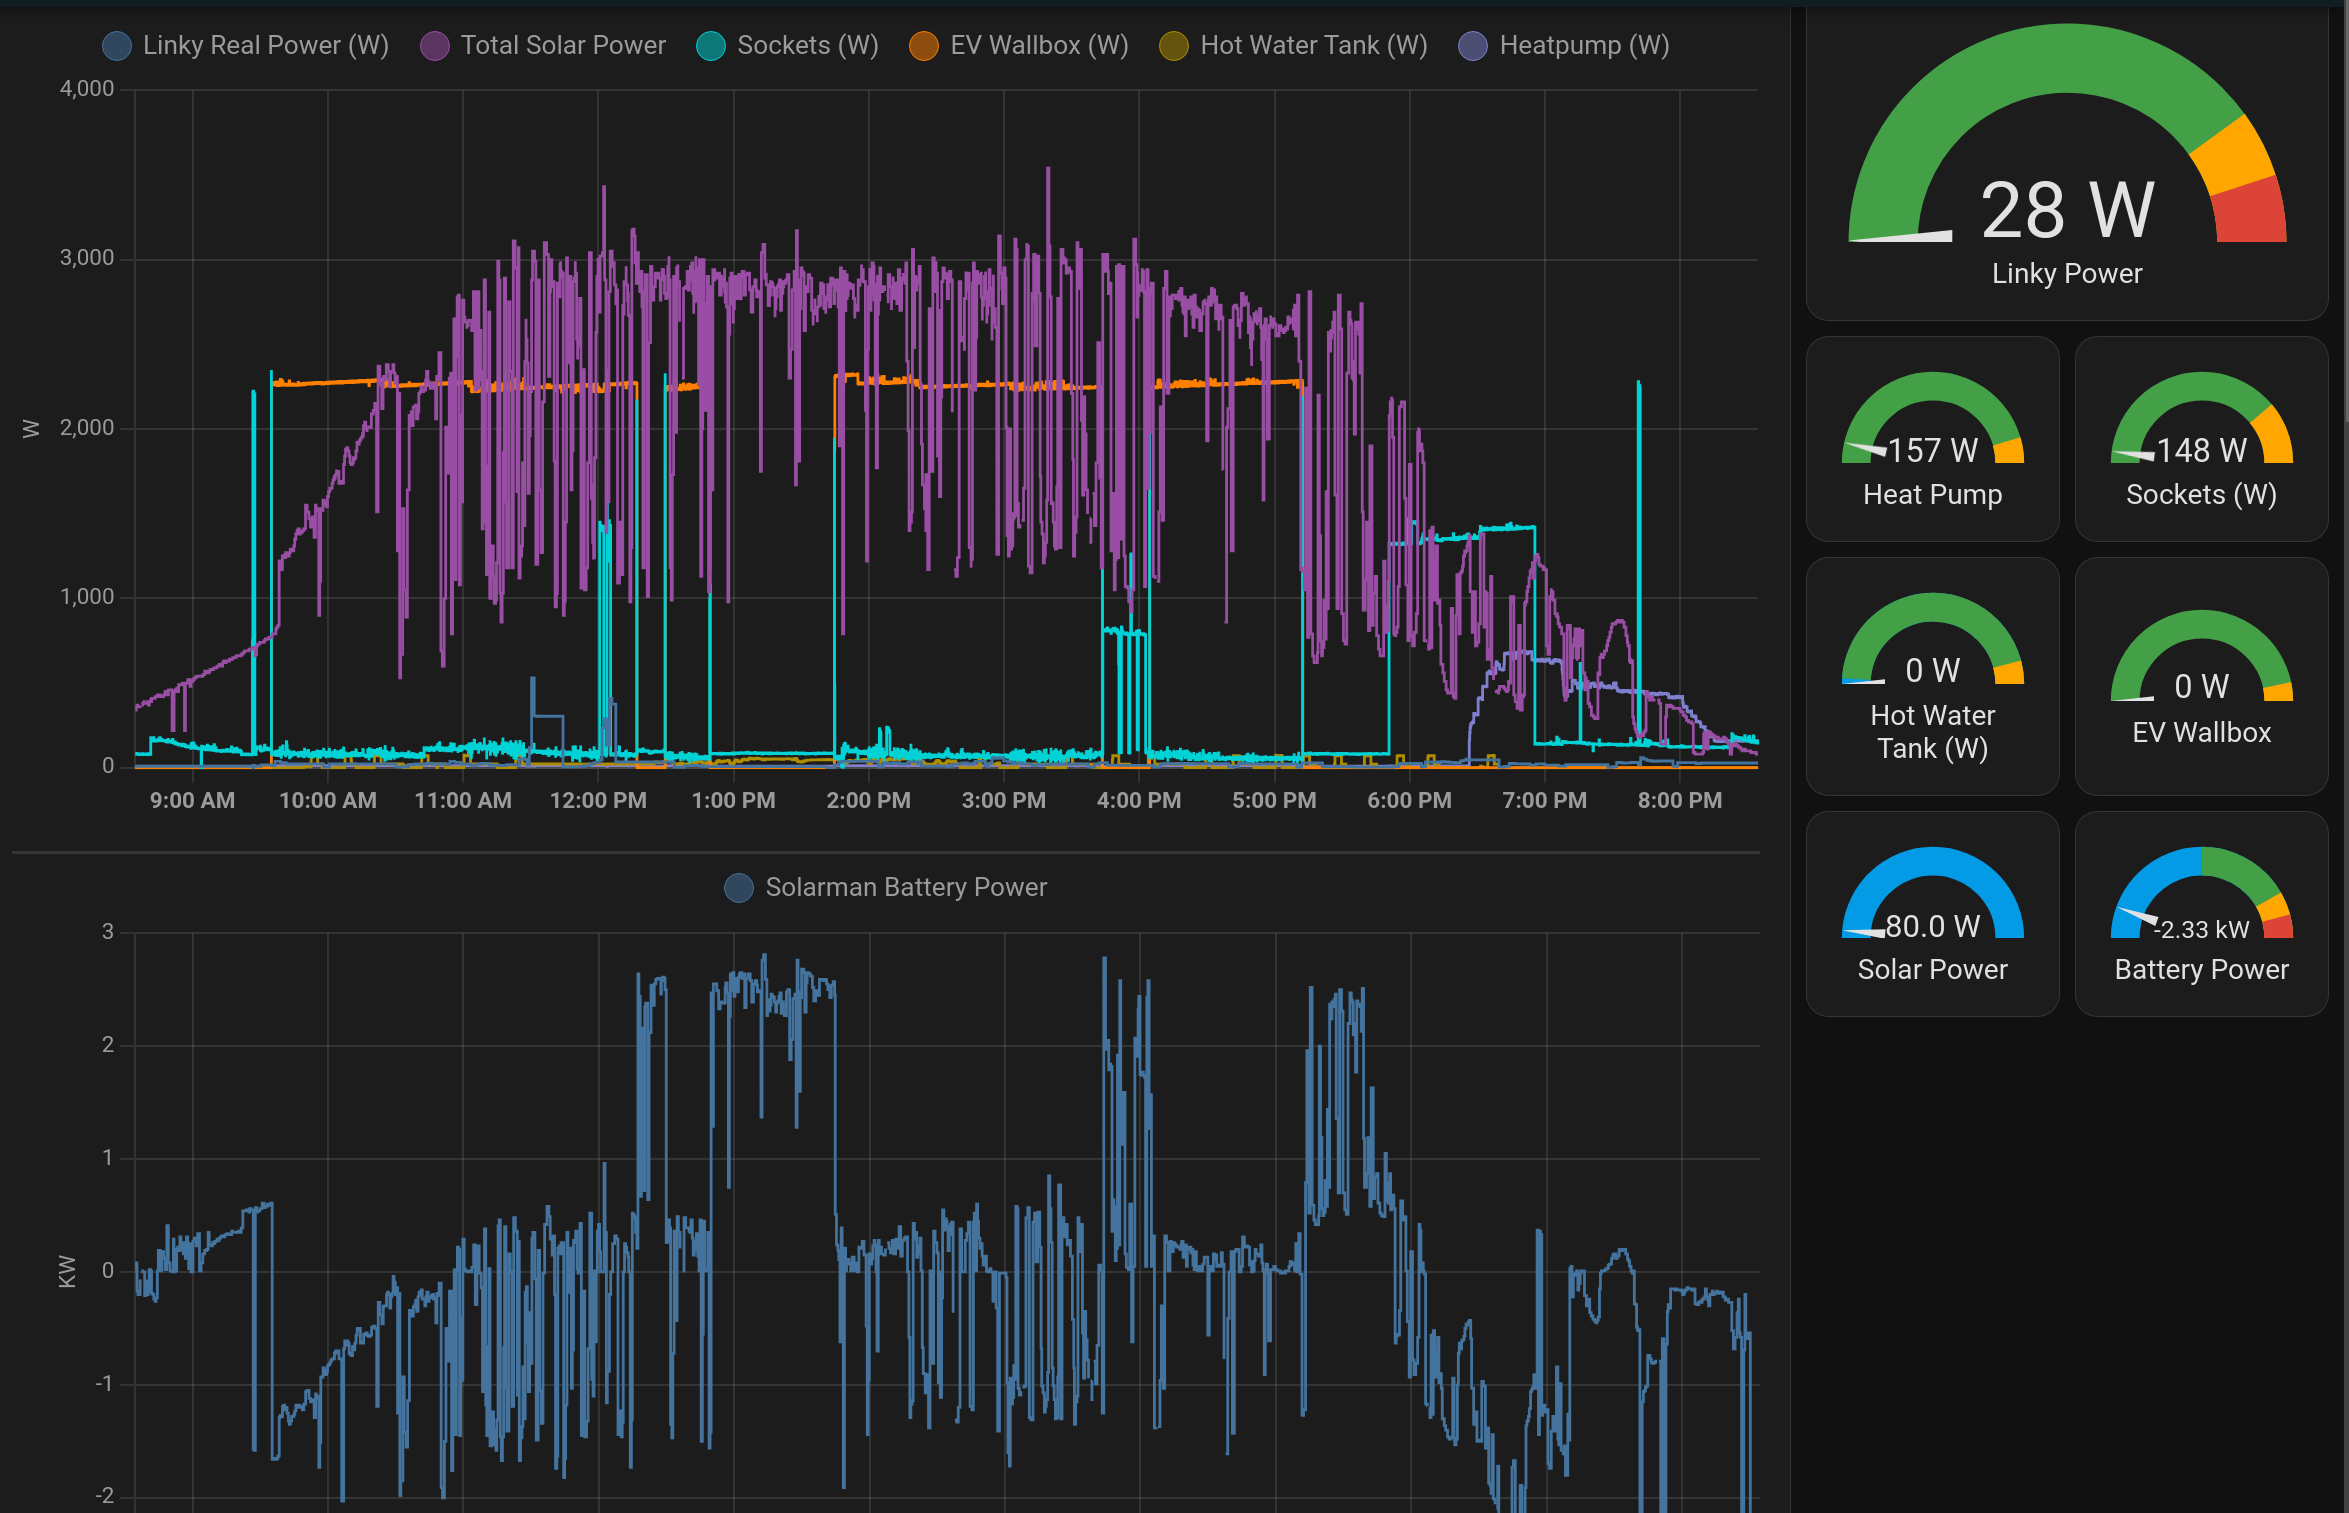
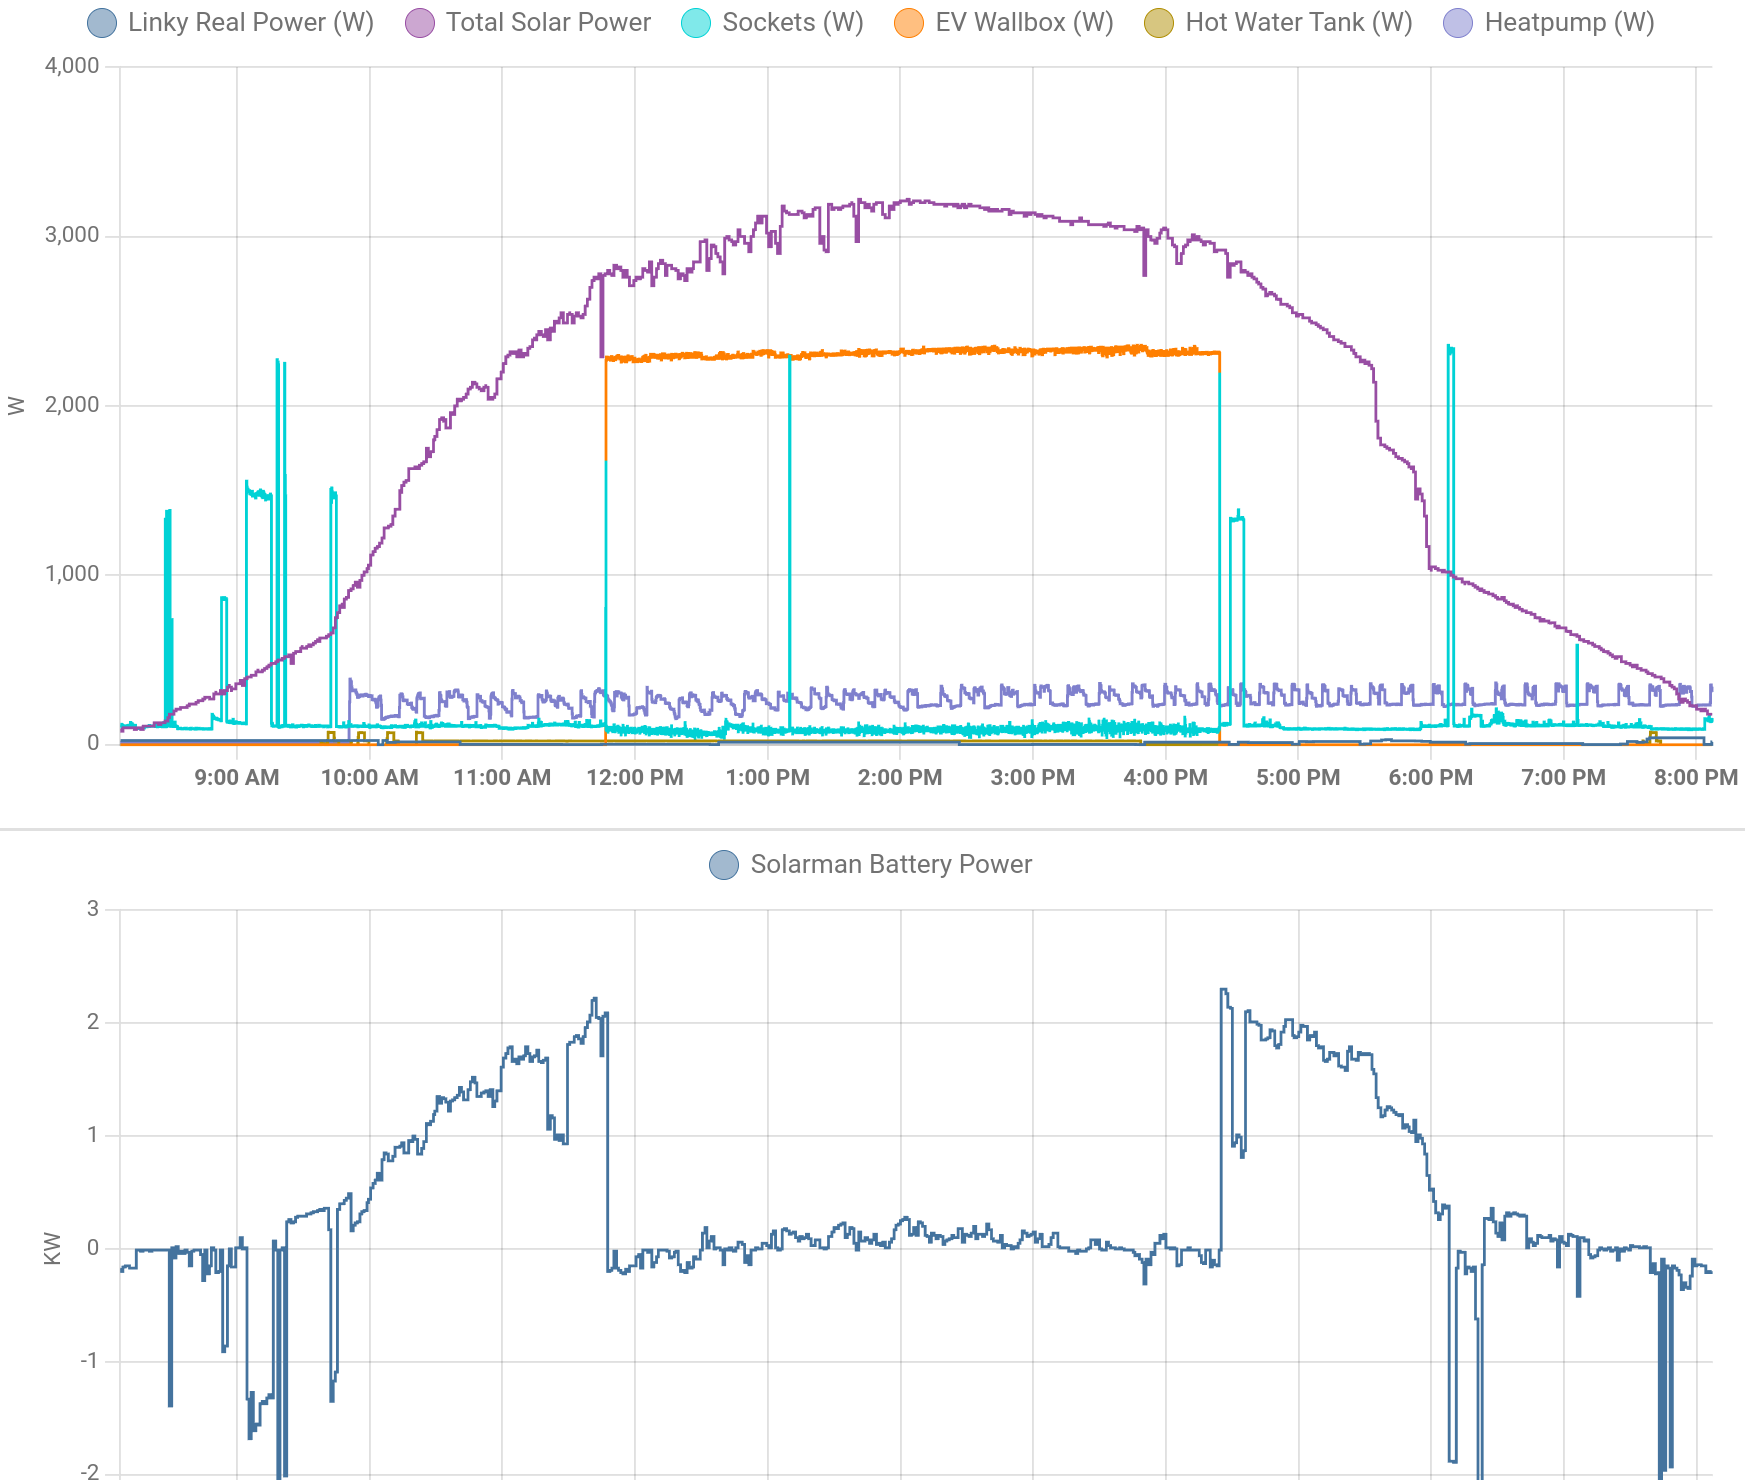
A typical spring and sunny Sunday (June 2nd), the car is plugged-in and charges at 2.4kW (10A). In summer, I only use about 40% of the car battery during the week (12.5kWh of the 32kWh on the MX-30), meaning about 5h30 of charge at 2.4kW to top it up.
All visible dips in the purple curve (solar power) are clouds, immediately compensated by the batteries.
At around 2PM you can see that there is
- 2.9kW of solar production
- 2.4kW that goes to the wallbox and in the car
- 0.35kW of excess power that goes into the house batteries
- 29W goes to the hot water tank's pump, circulating the glycol to the thermal panels
- 12W goes to the heat pump, corresponding to its idle consumption
- 69W goes to the sockets, covering the audio bay, PoE stuff, laptop, etc.
You may also notice peaks of solar above 3kW, despite the inverter rating of 3kW. That's because on the DC side (solar panels + batteries) the inverter can reach 3.5KW.
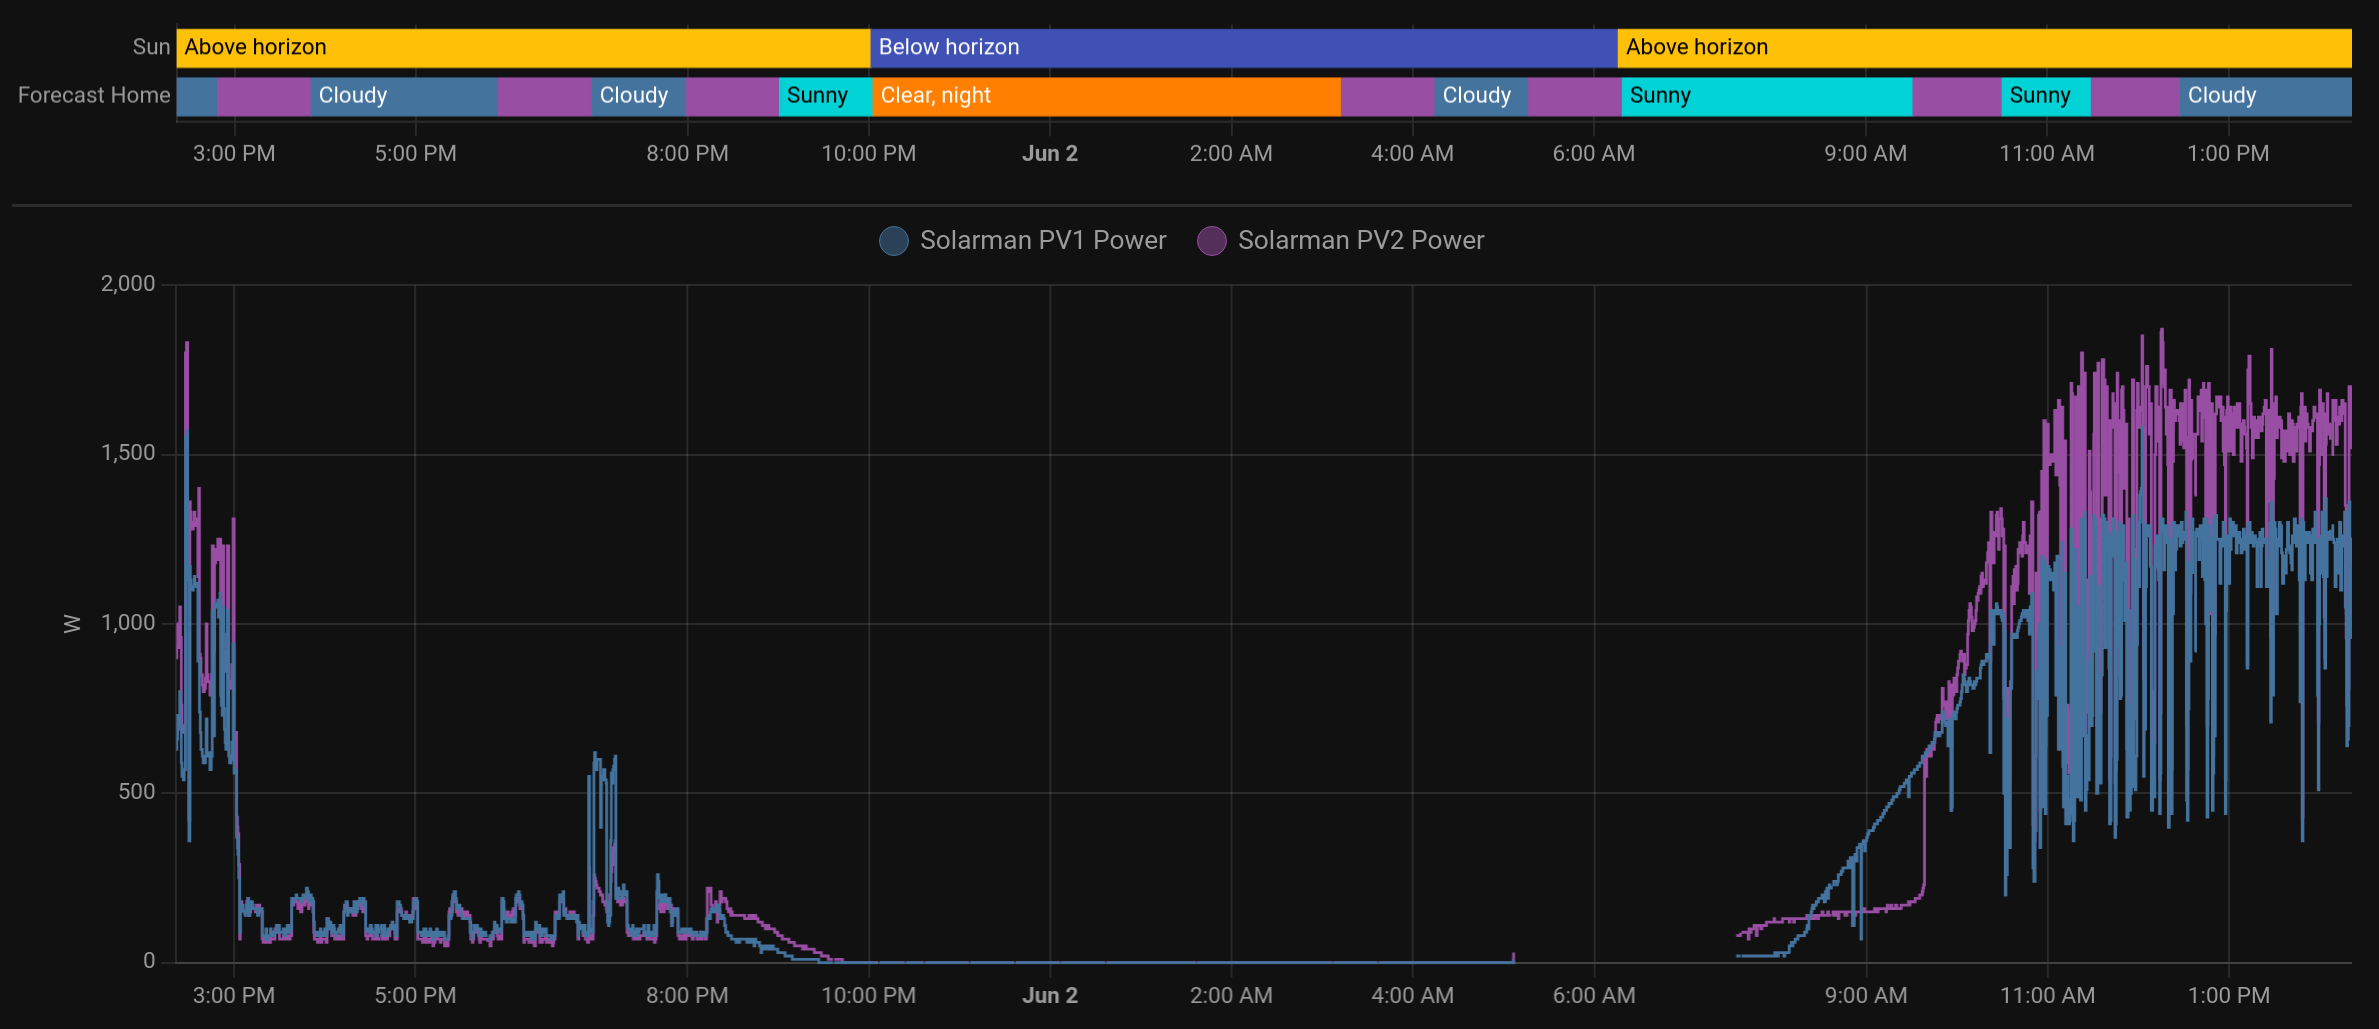
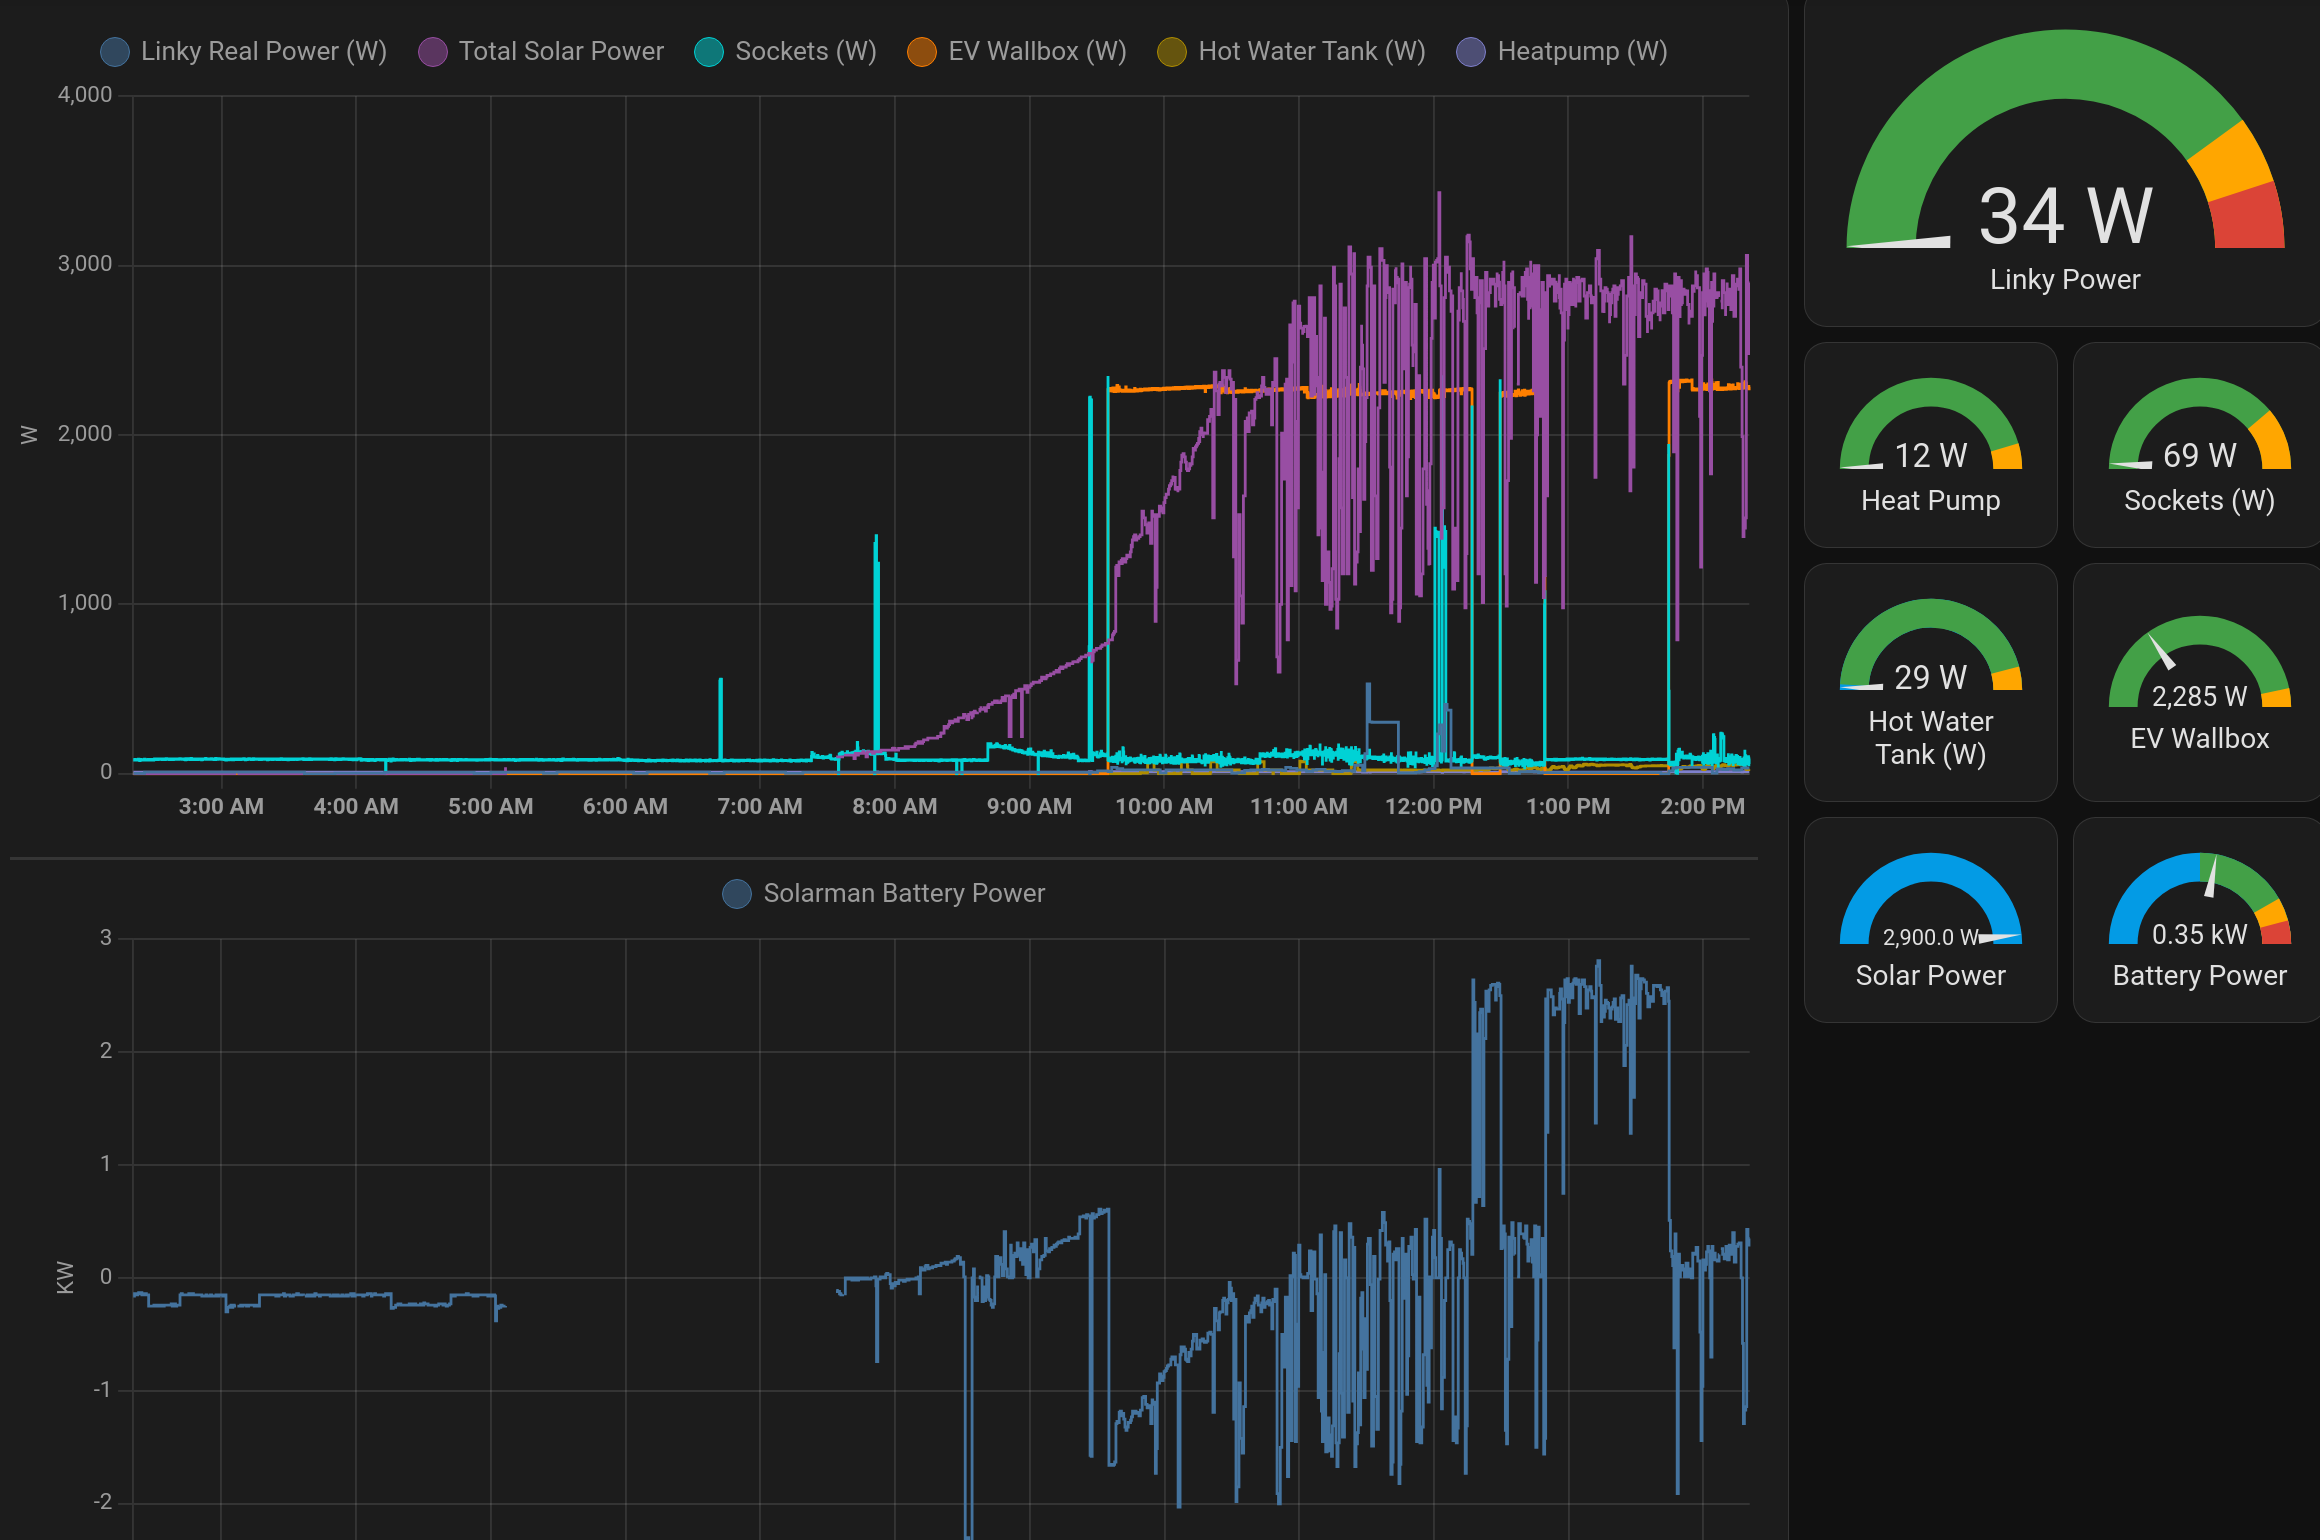
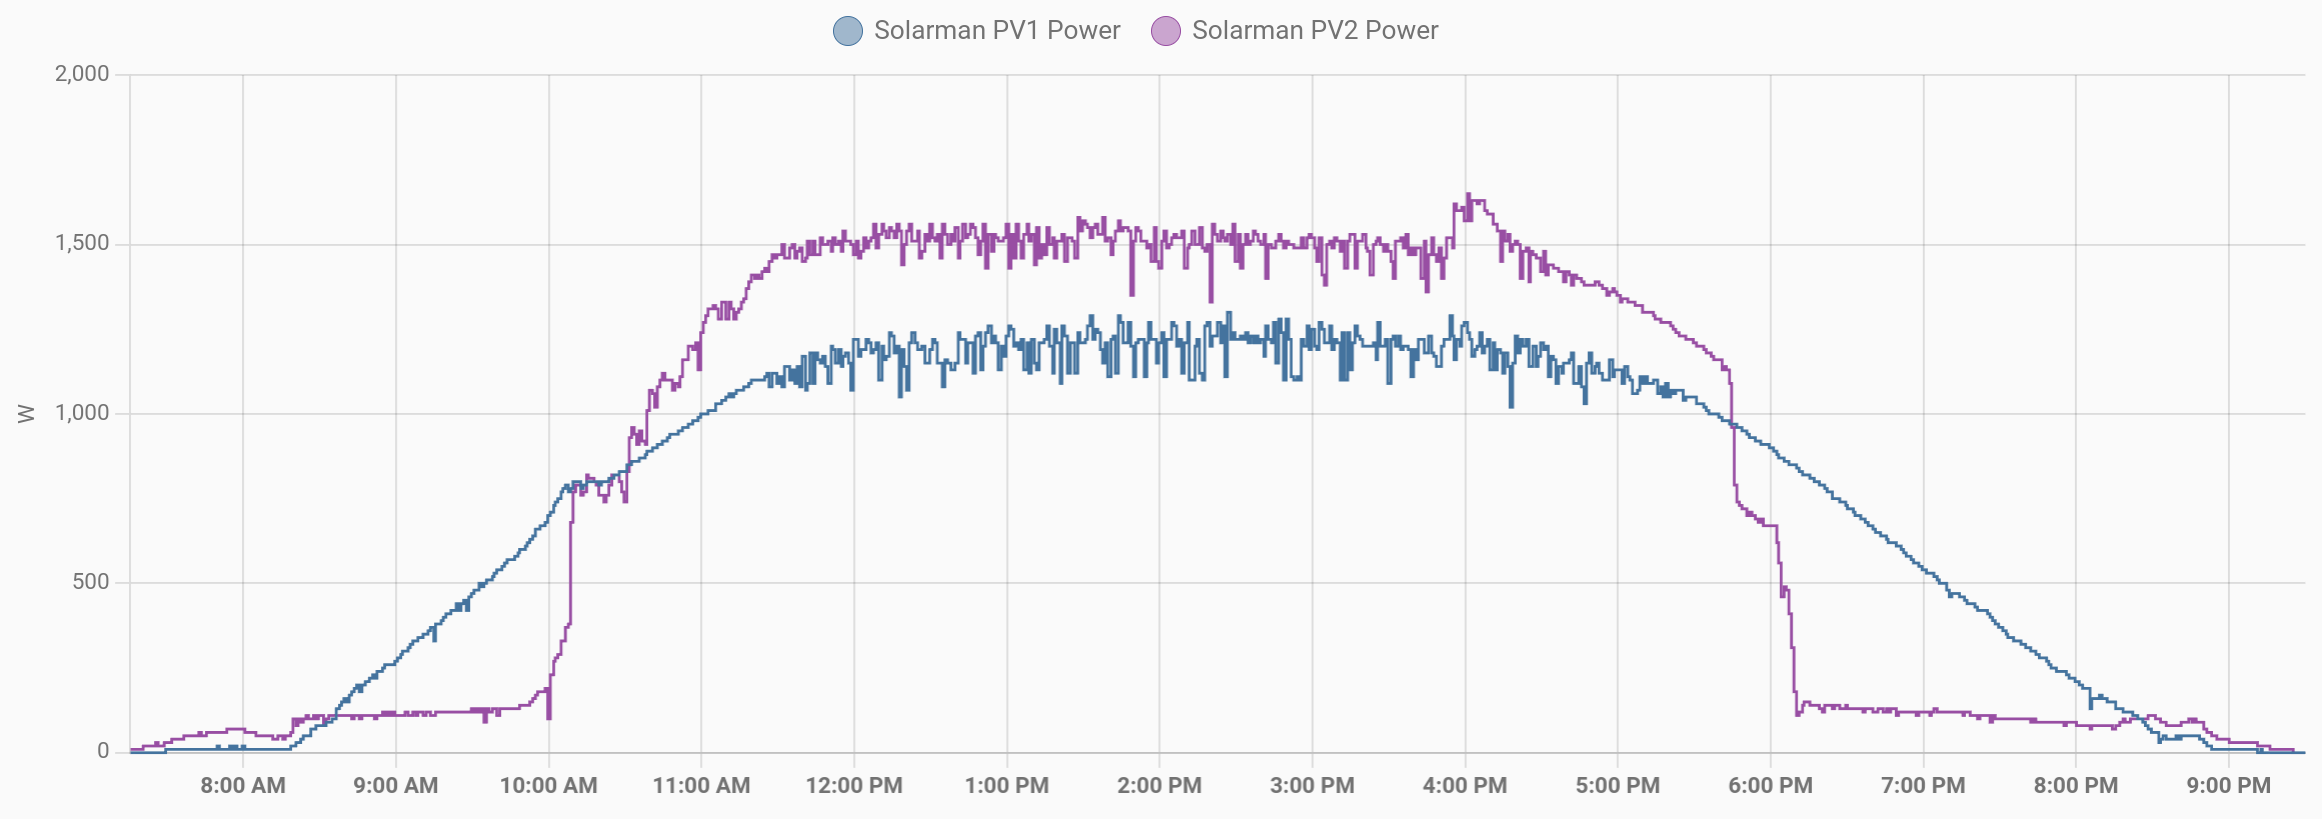
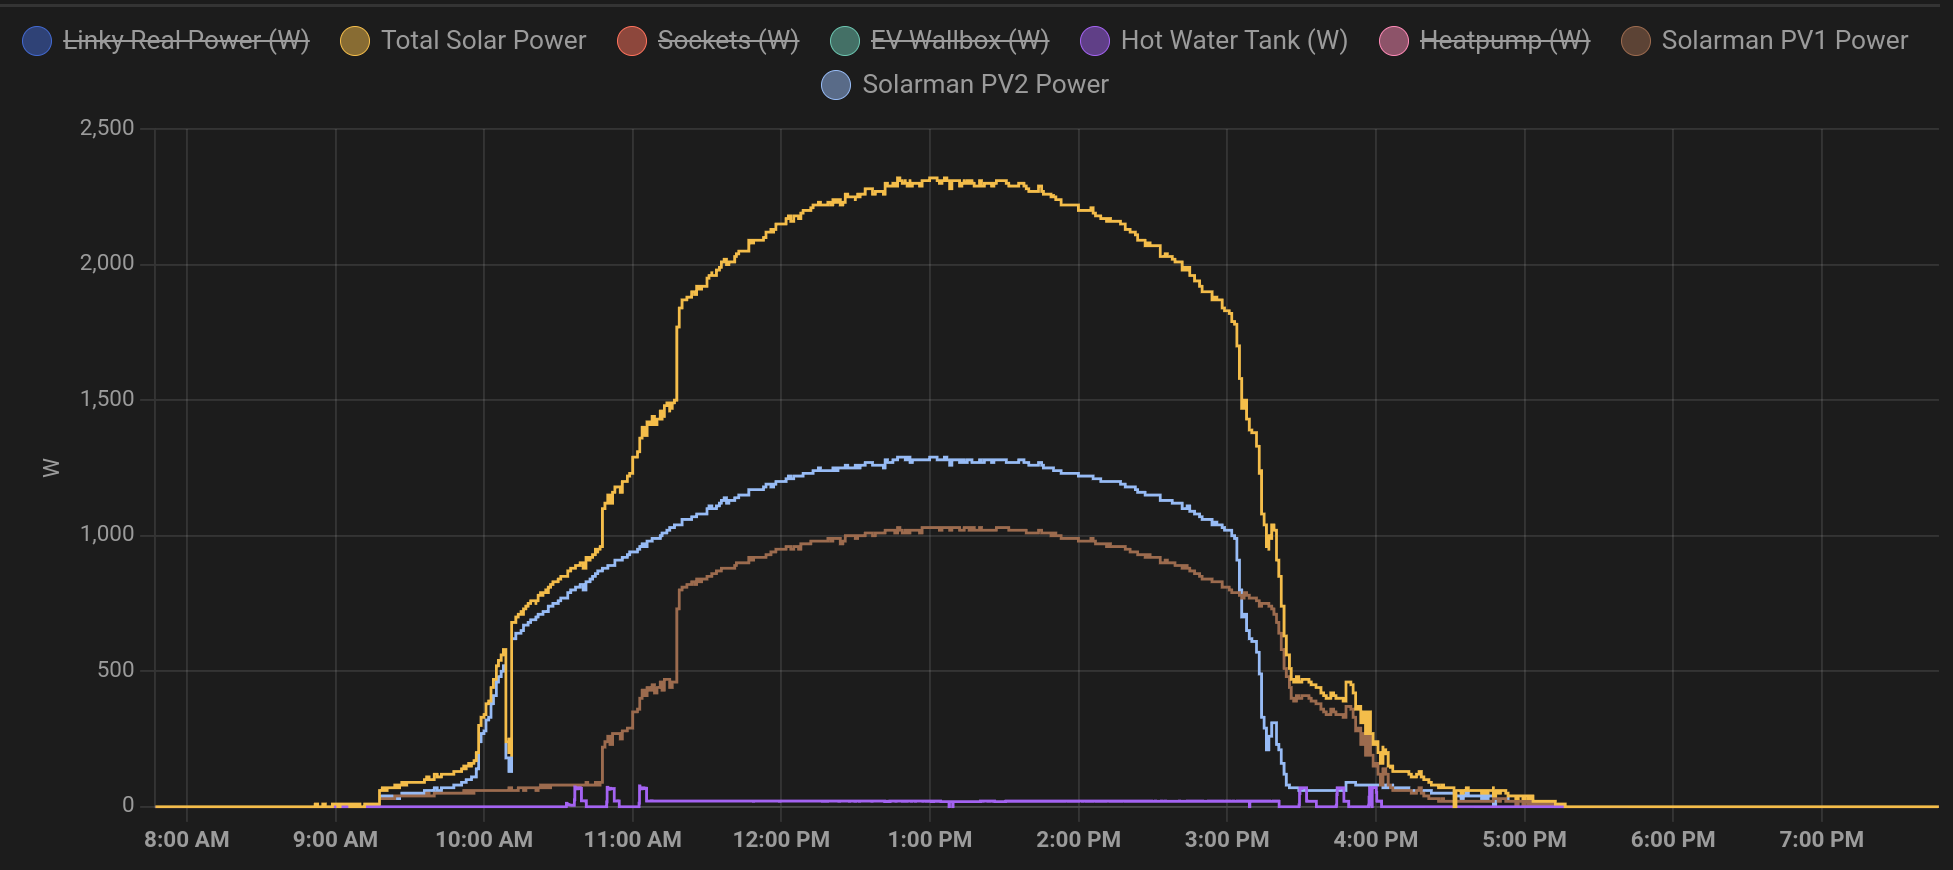
Here we can see the two strings. String one (PV1) is 1.74kWc and string two (PV2) is 2.4kWc.
PV2 (purple) starts earlier in the morning due to its larger surface and wattage, but as it is laying flat on the ground it stays in the shadows until 9h45 then rises sharply. PV1 (blue) on the other hand is perfectly exposed to the south at 30° and has a very gradual start.
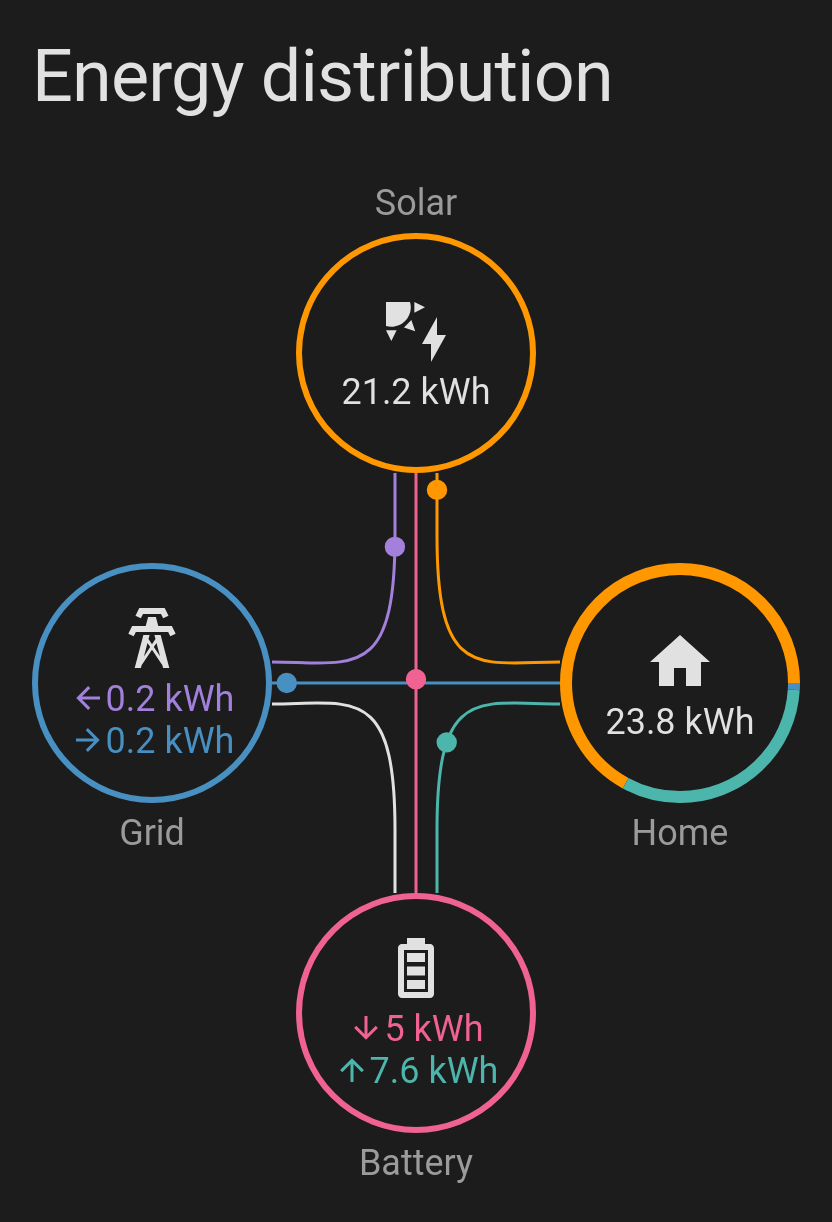
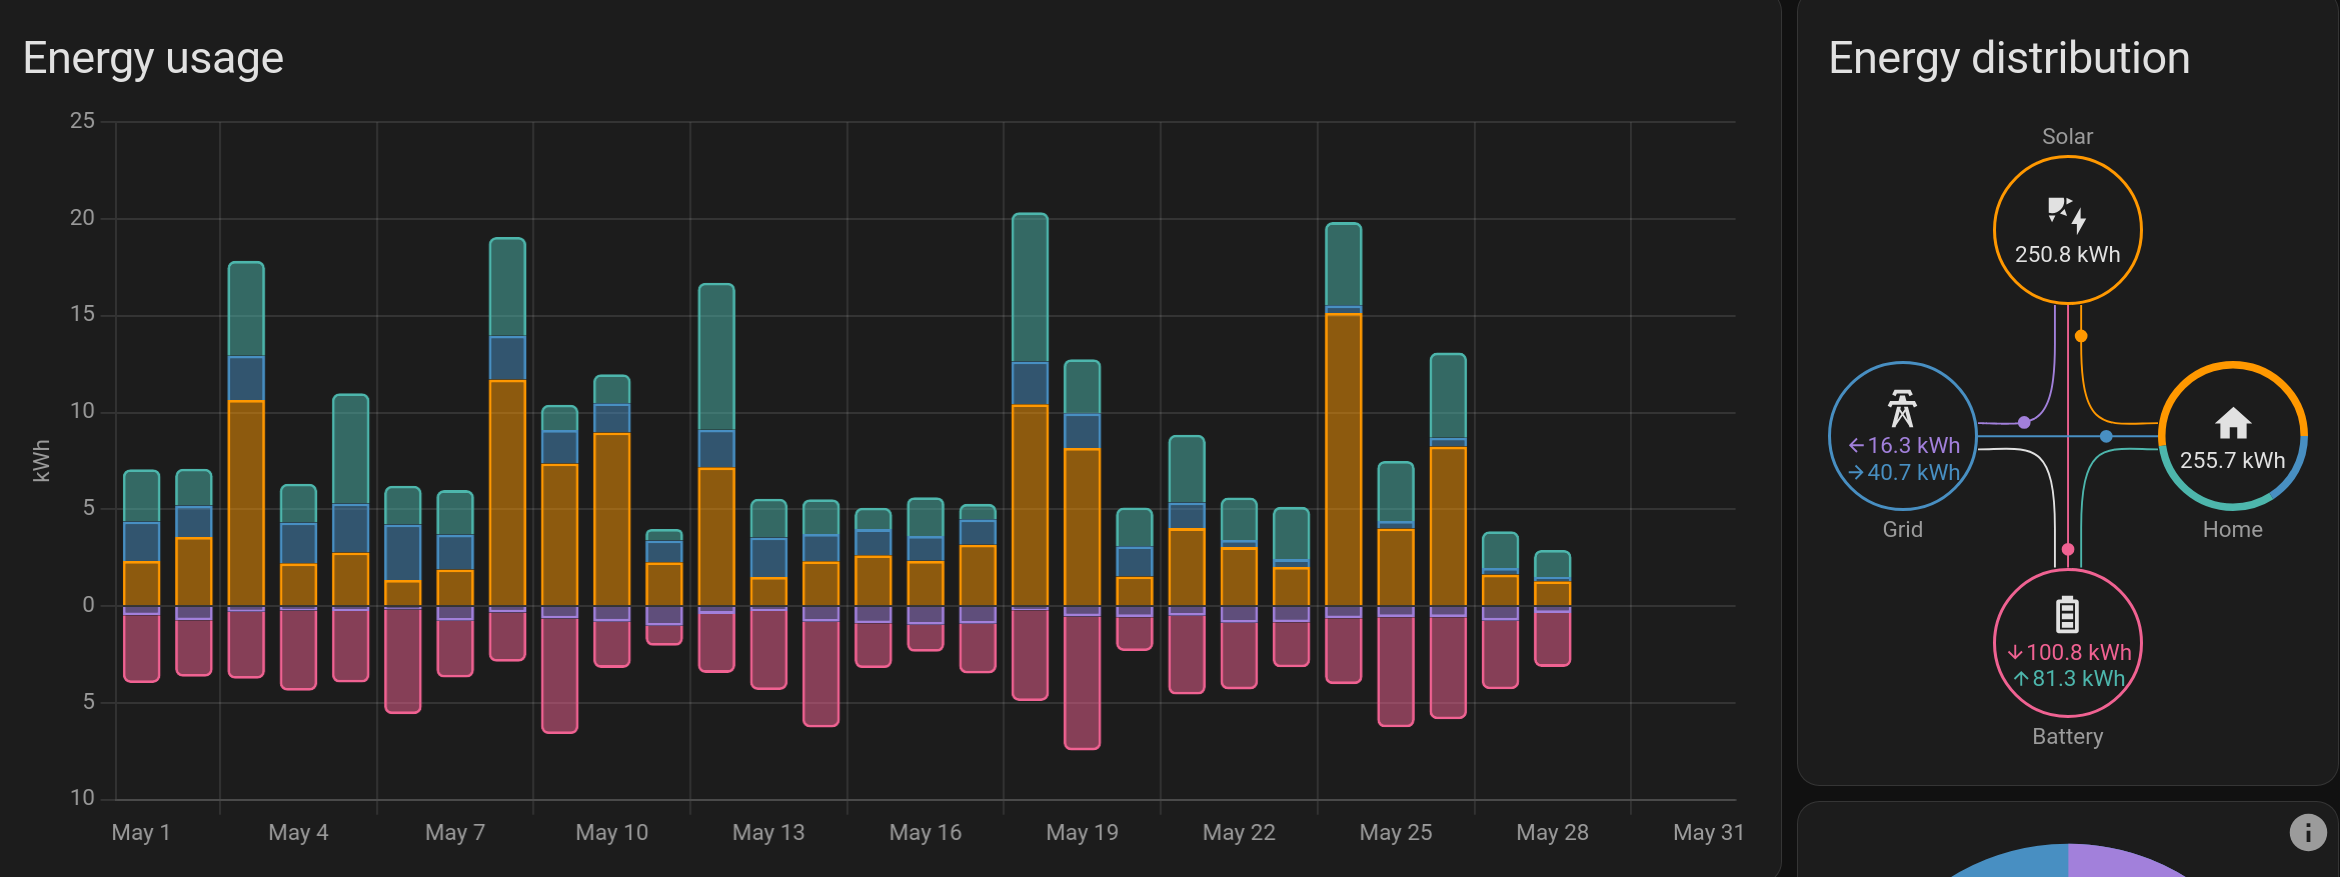
This diagram shows the energy distribution for June 2nd 2024. On that day, the car was charged, the motorcycle was topped-up, the washing machine did a cycle, so did the dishwasher. I also experimented with making tofu from lentils (a pathetic fail) which had to cook for a while. And the heat pump also ran for some time to cool the attic in the evening.
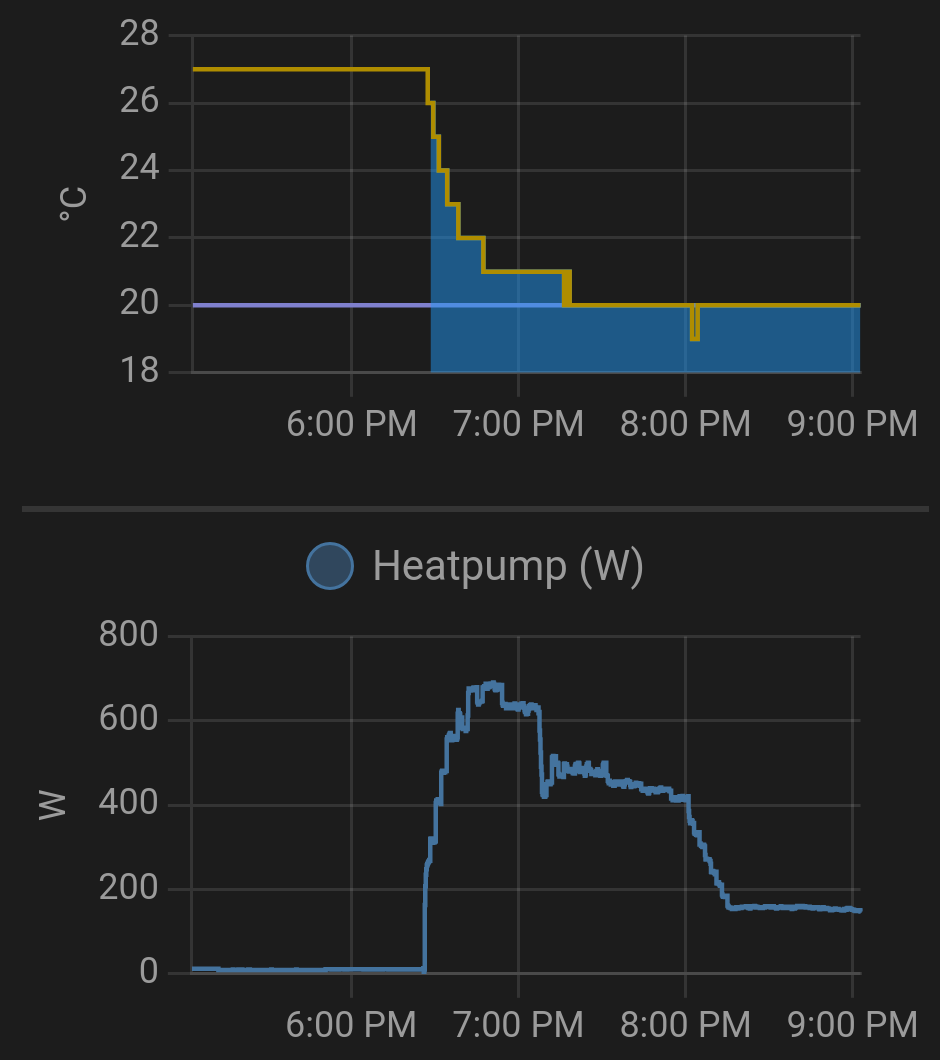
Above is a heatpump cycle to cool down the attic in the evening.
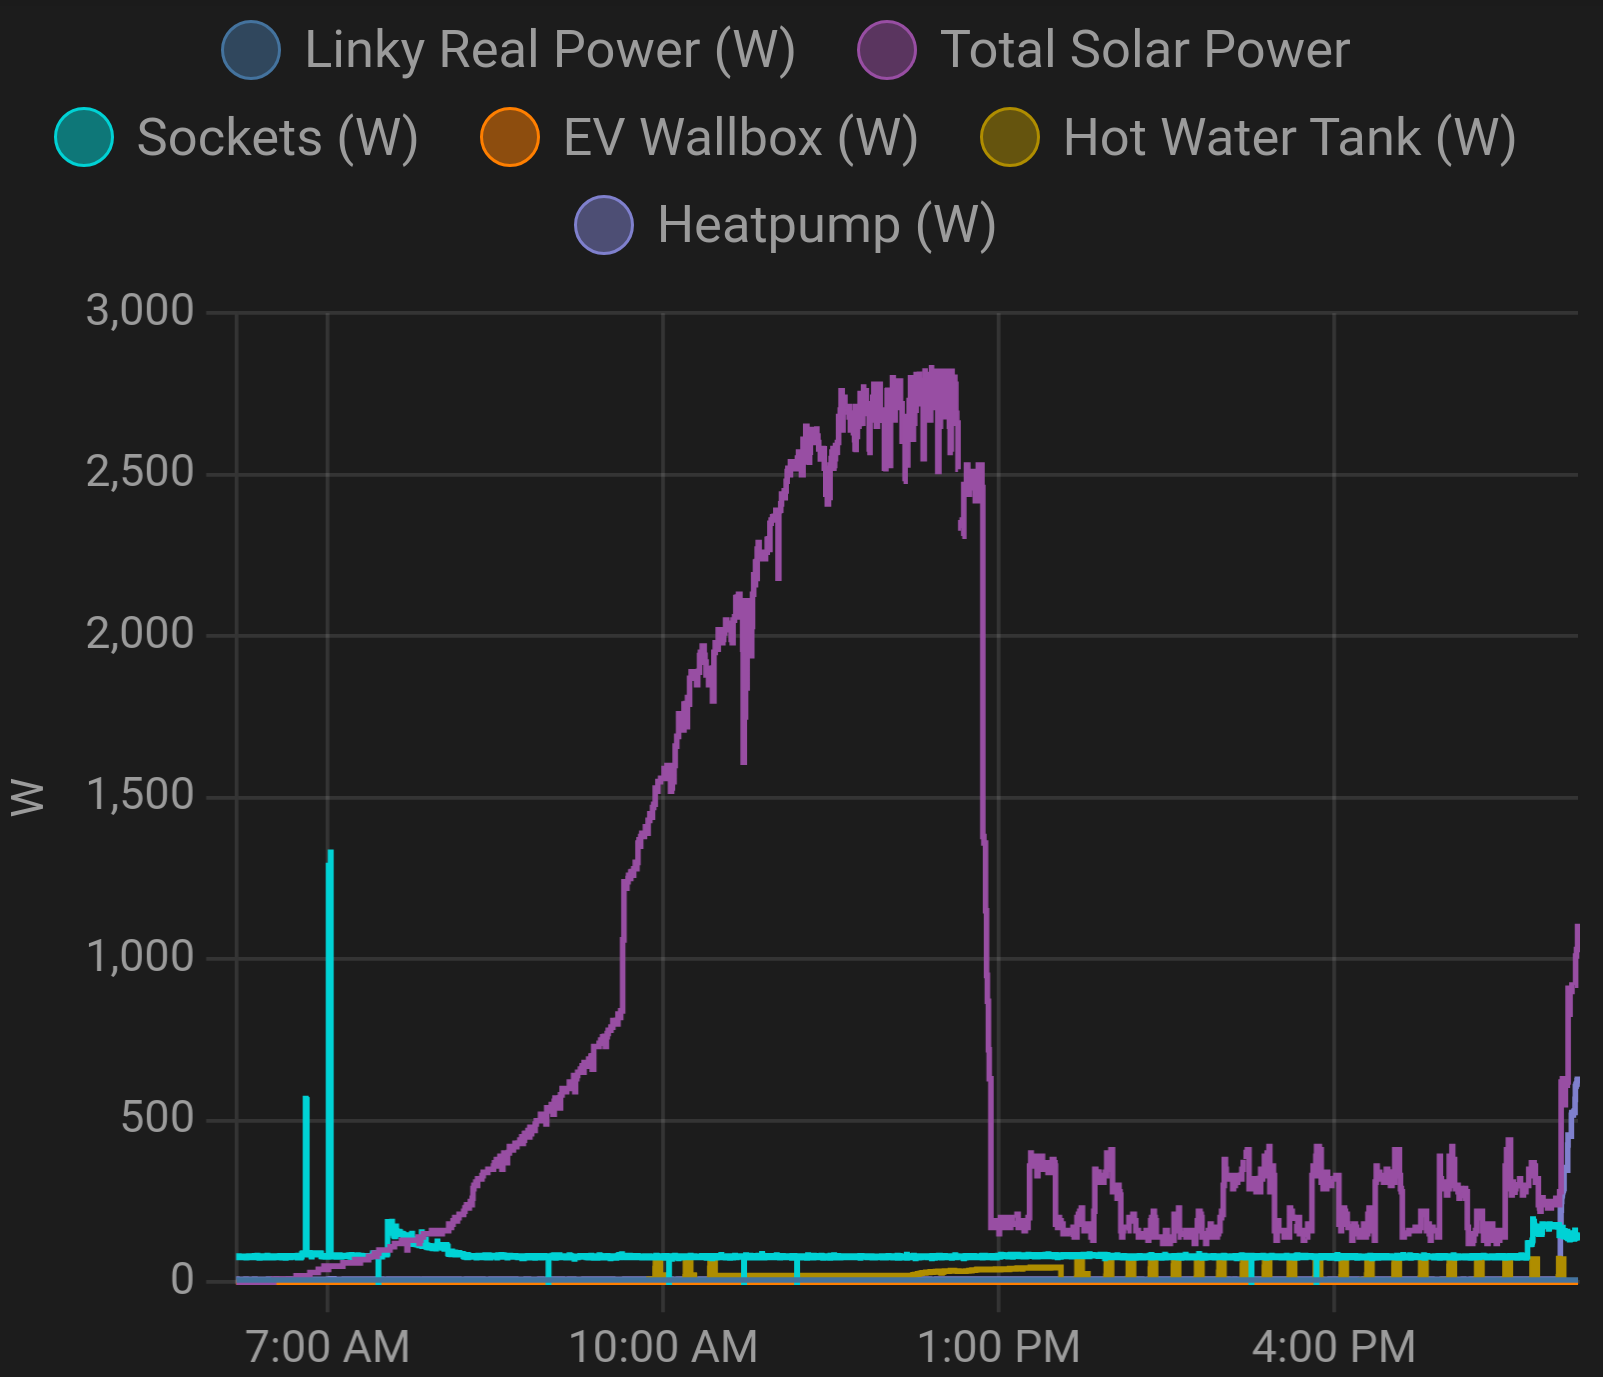
Here you can see the next day. The batteries charge up until 1PM to reach 100%, at which point solar production cuts off. I don't have a contract to sell my production excess. It oscilates in the afternoon due to the refregirator kicking in and finaly starts back by up in the evening for the heat pump.
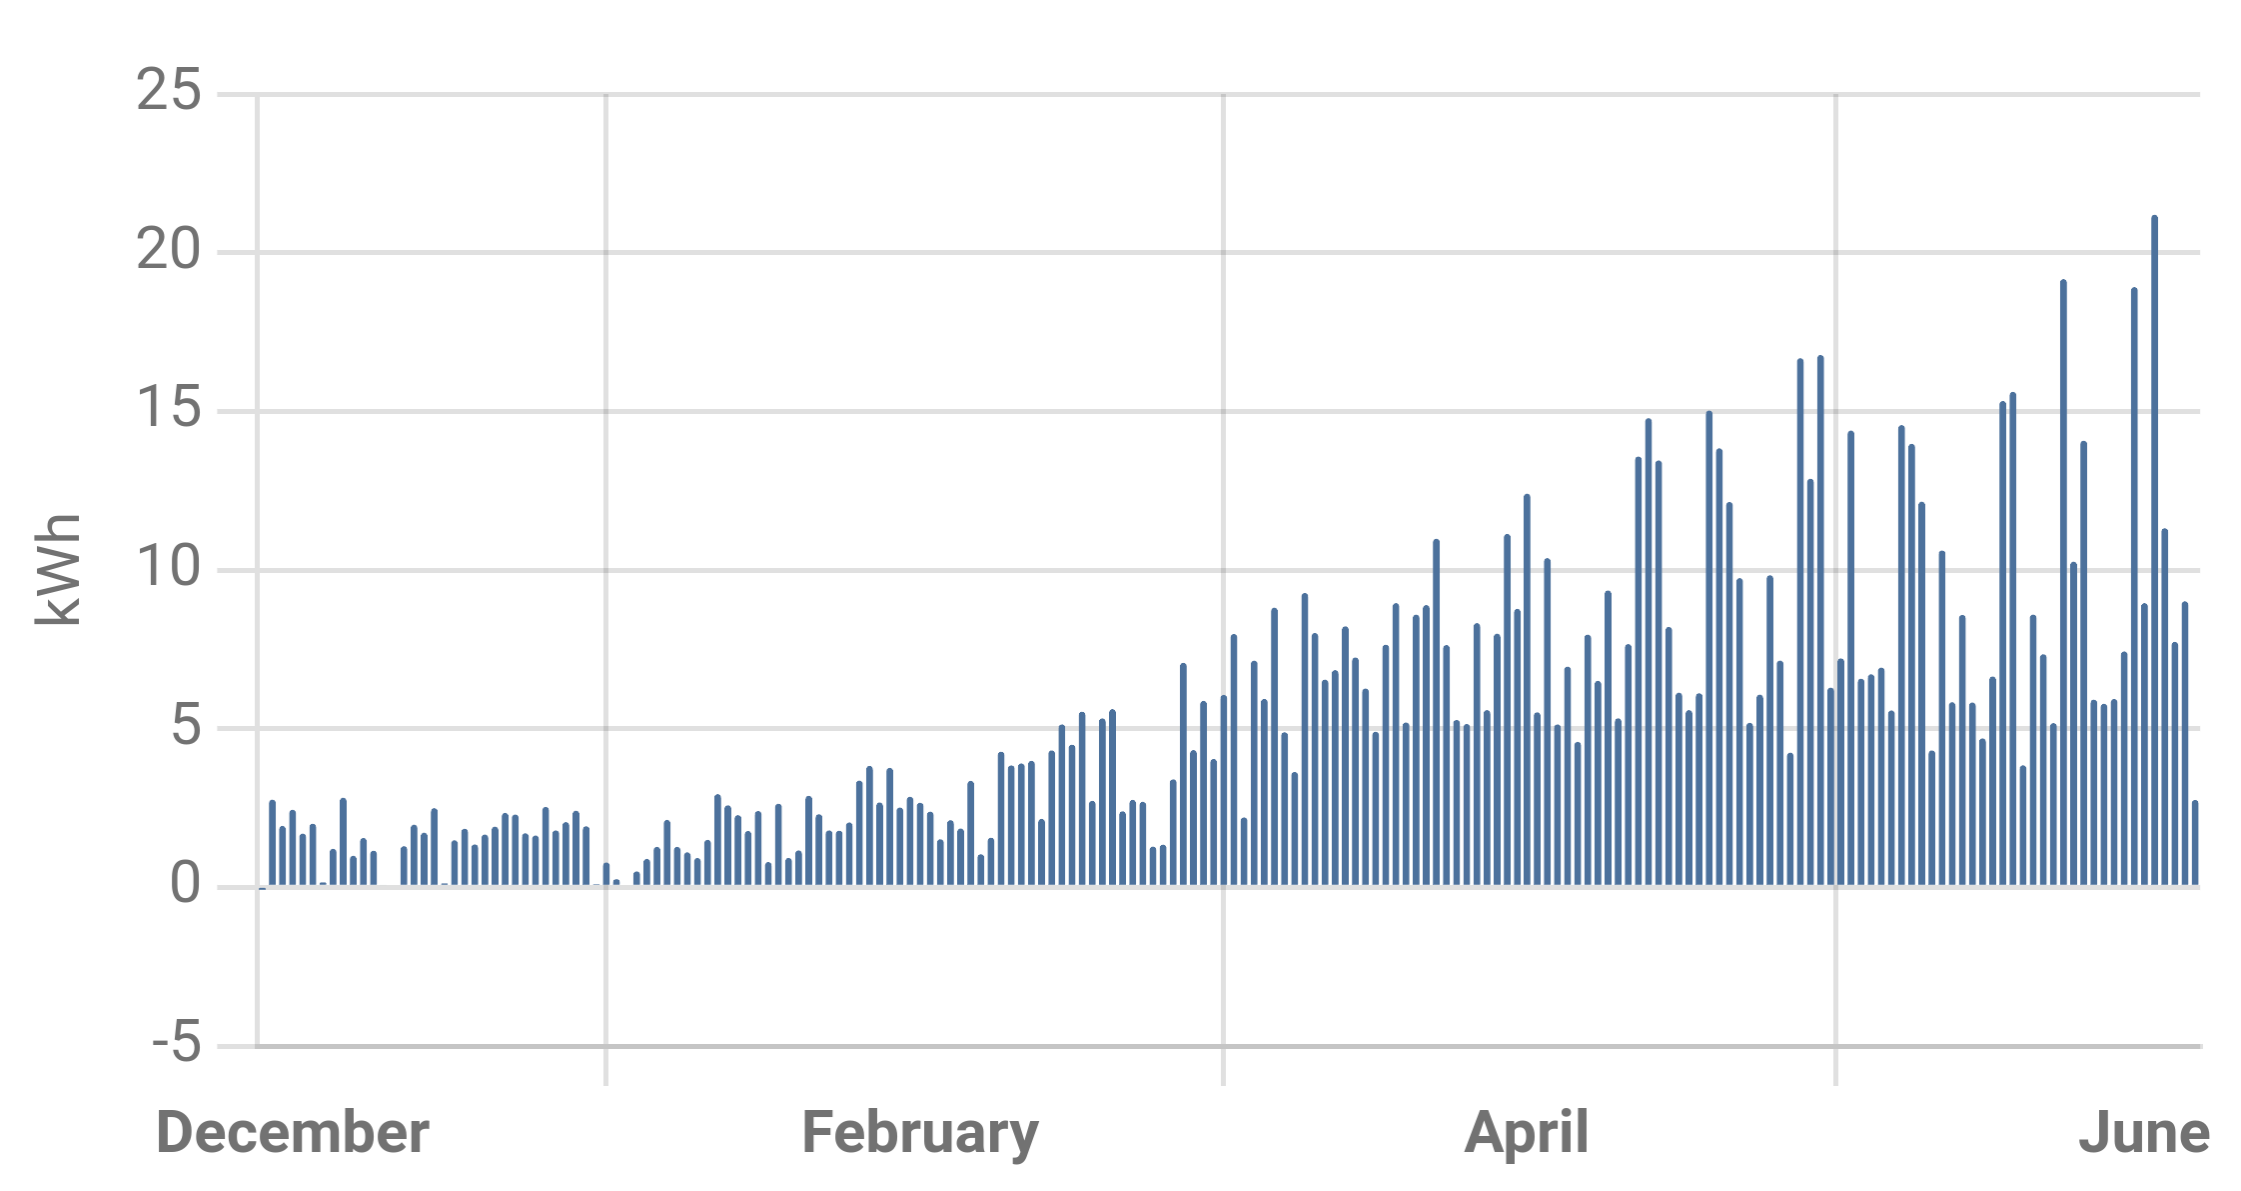
Above is a graph showing the daily photovoltaic solar production in 2023-2024.
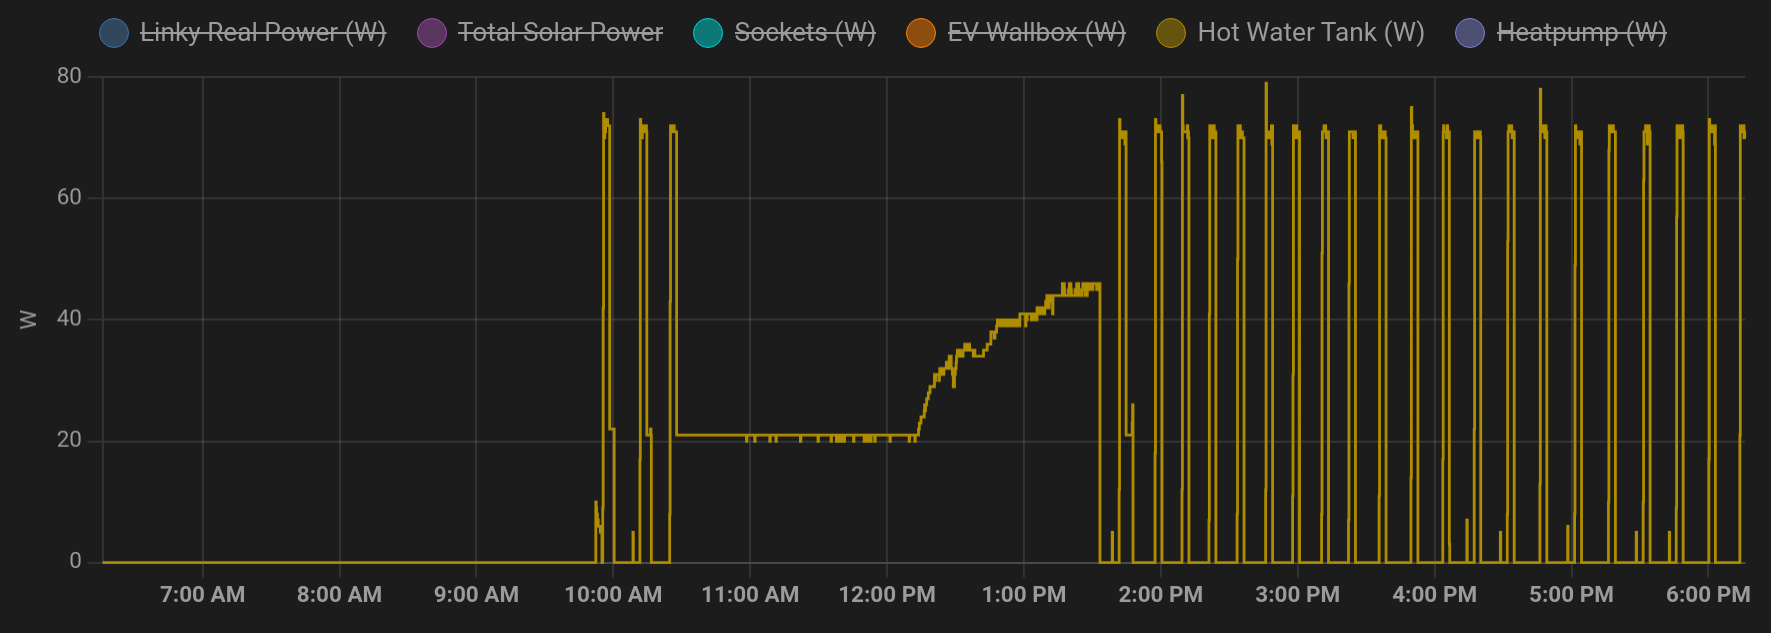
You can also see the hot water tank's pump in yellow, that rises progressively and cuts off by 2PM, after that it runs in short cycles to maintain its temperature target. This is very typical of strong solar radiation where only a few hours of sun can heat up the whole tank.
In winter, the curve follows the sun and falls slowly in the afternoon, almost never entering the short top-up cycles.
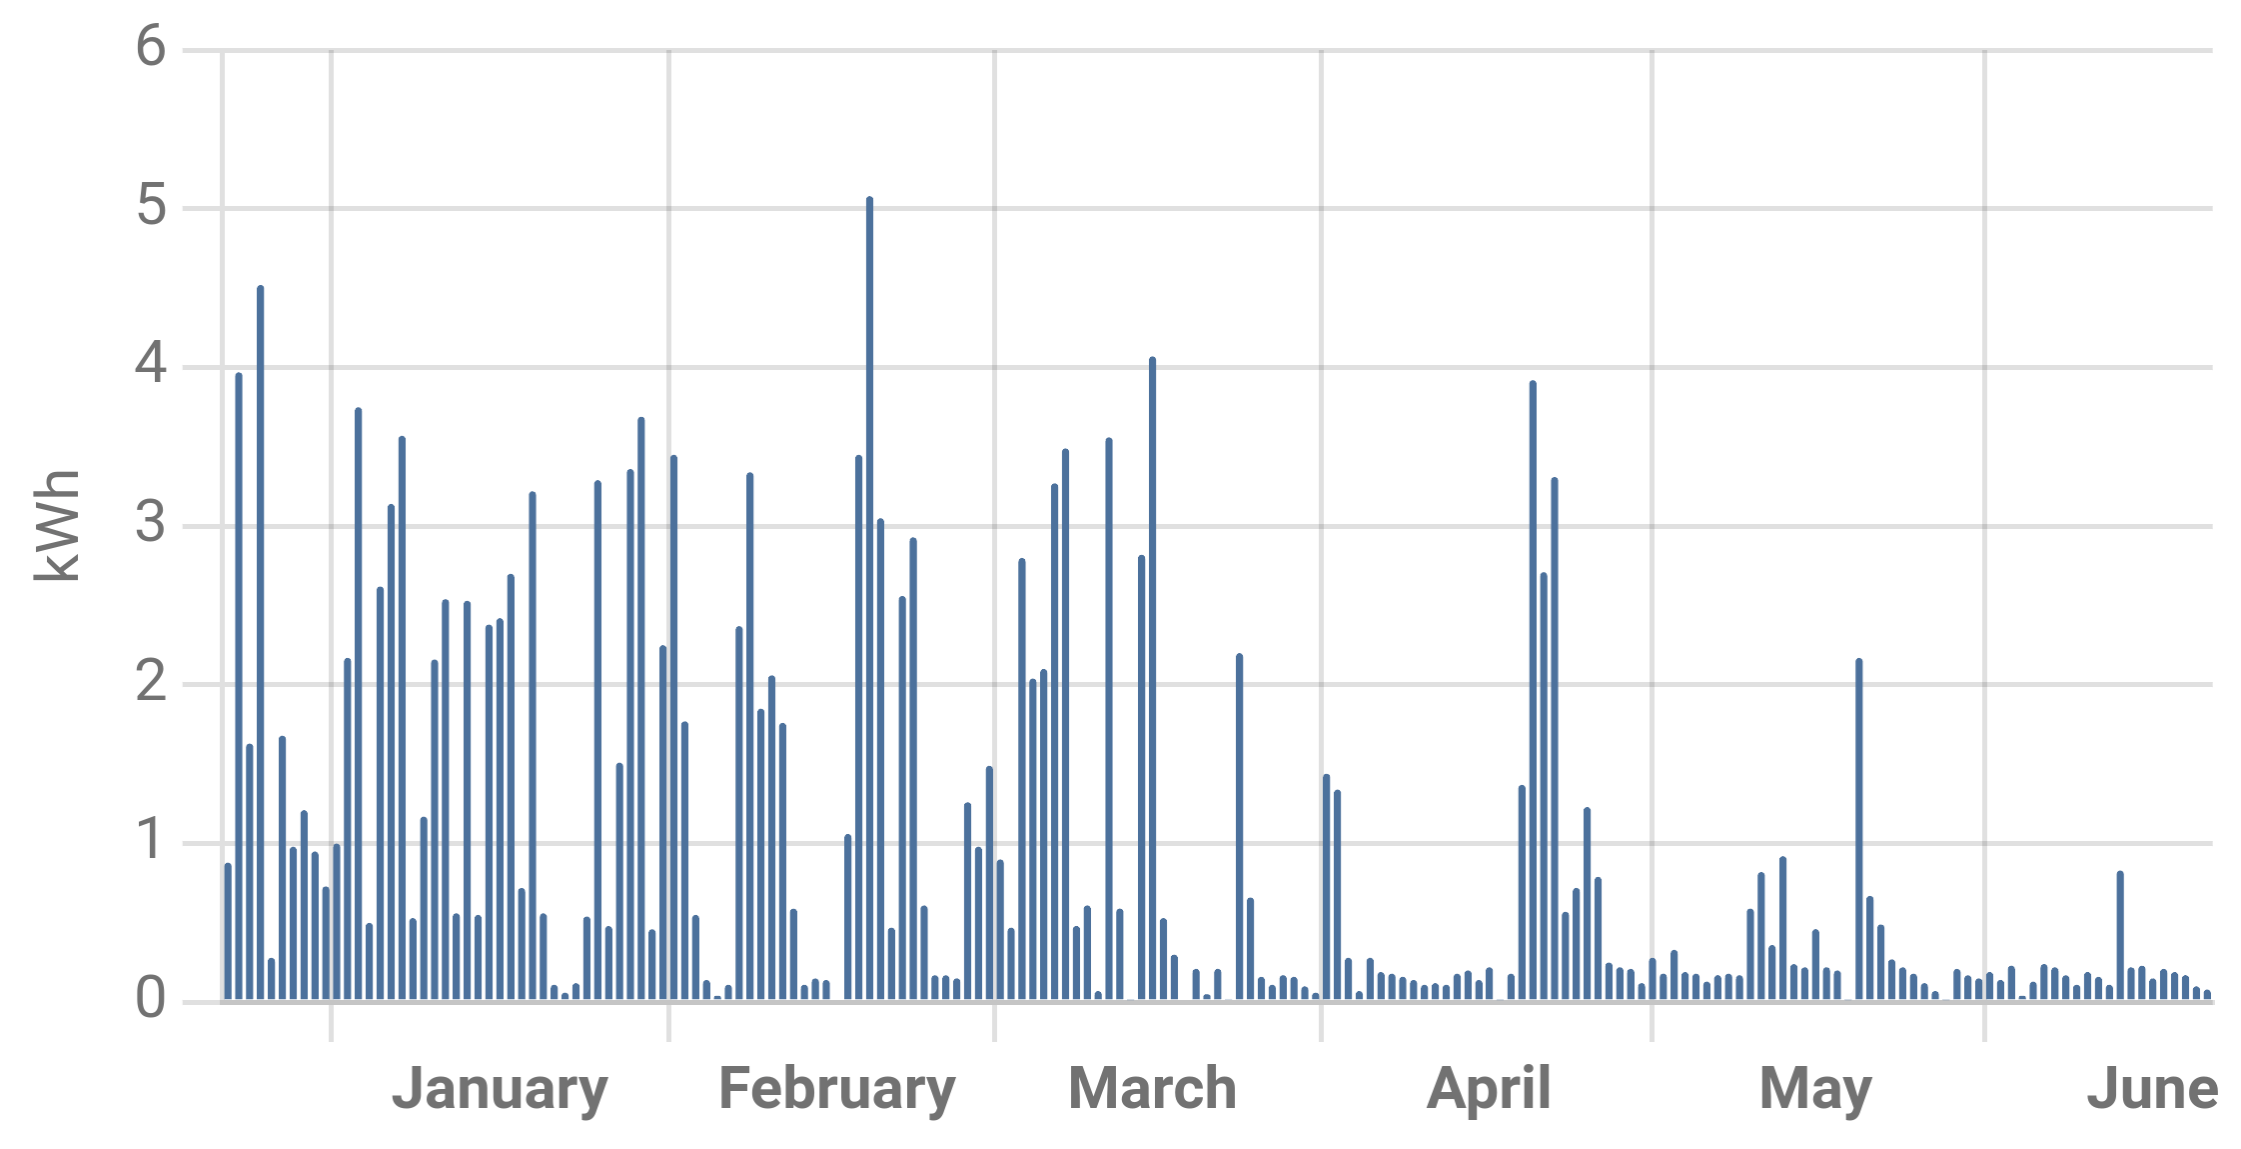
Above is the daily consumption of the hot water tank (heater element and pump) in 2024.
This is extremely close to shortest day of the year, and with a fully sunny day, it allows a charge of the house batteries from 20% to 100% with absolutely nothing to spare (~8kWh of charge plus ~2kWh of self consumption during the sunny hours).
The difference in instantaneous power between the two strings is mostly explained by PV2 having a much steeper angle.
Everyday monitoring
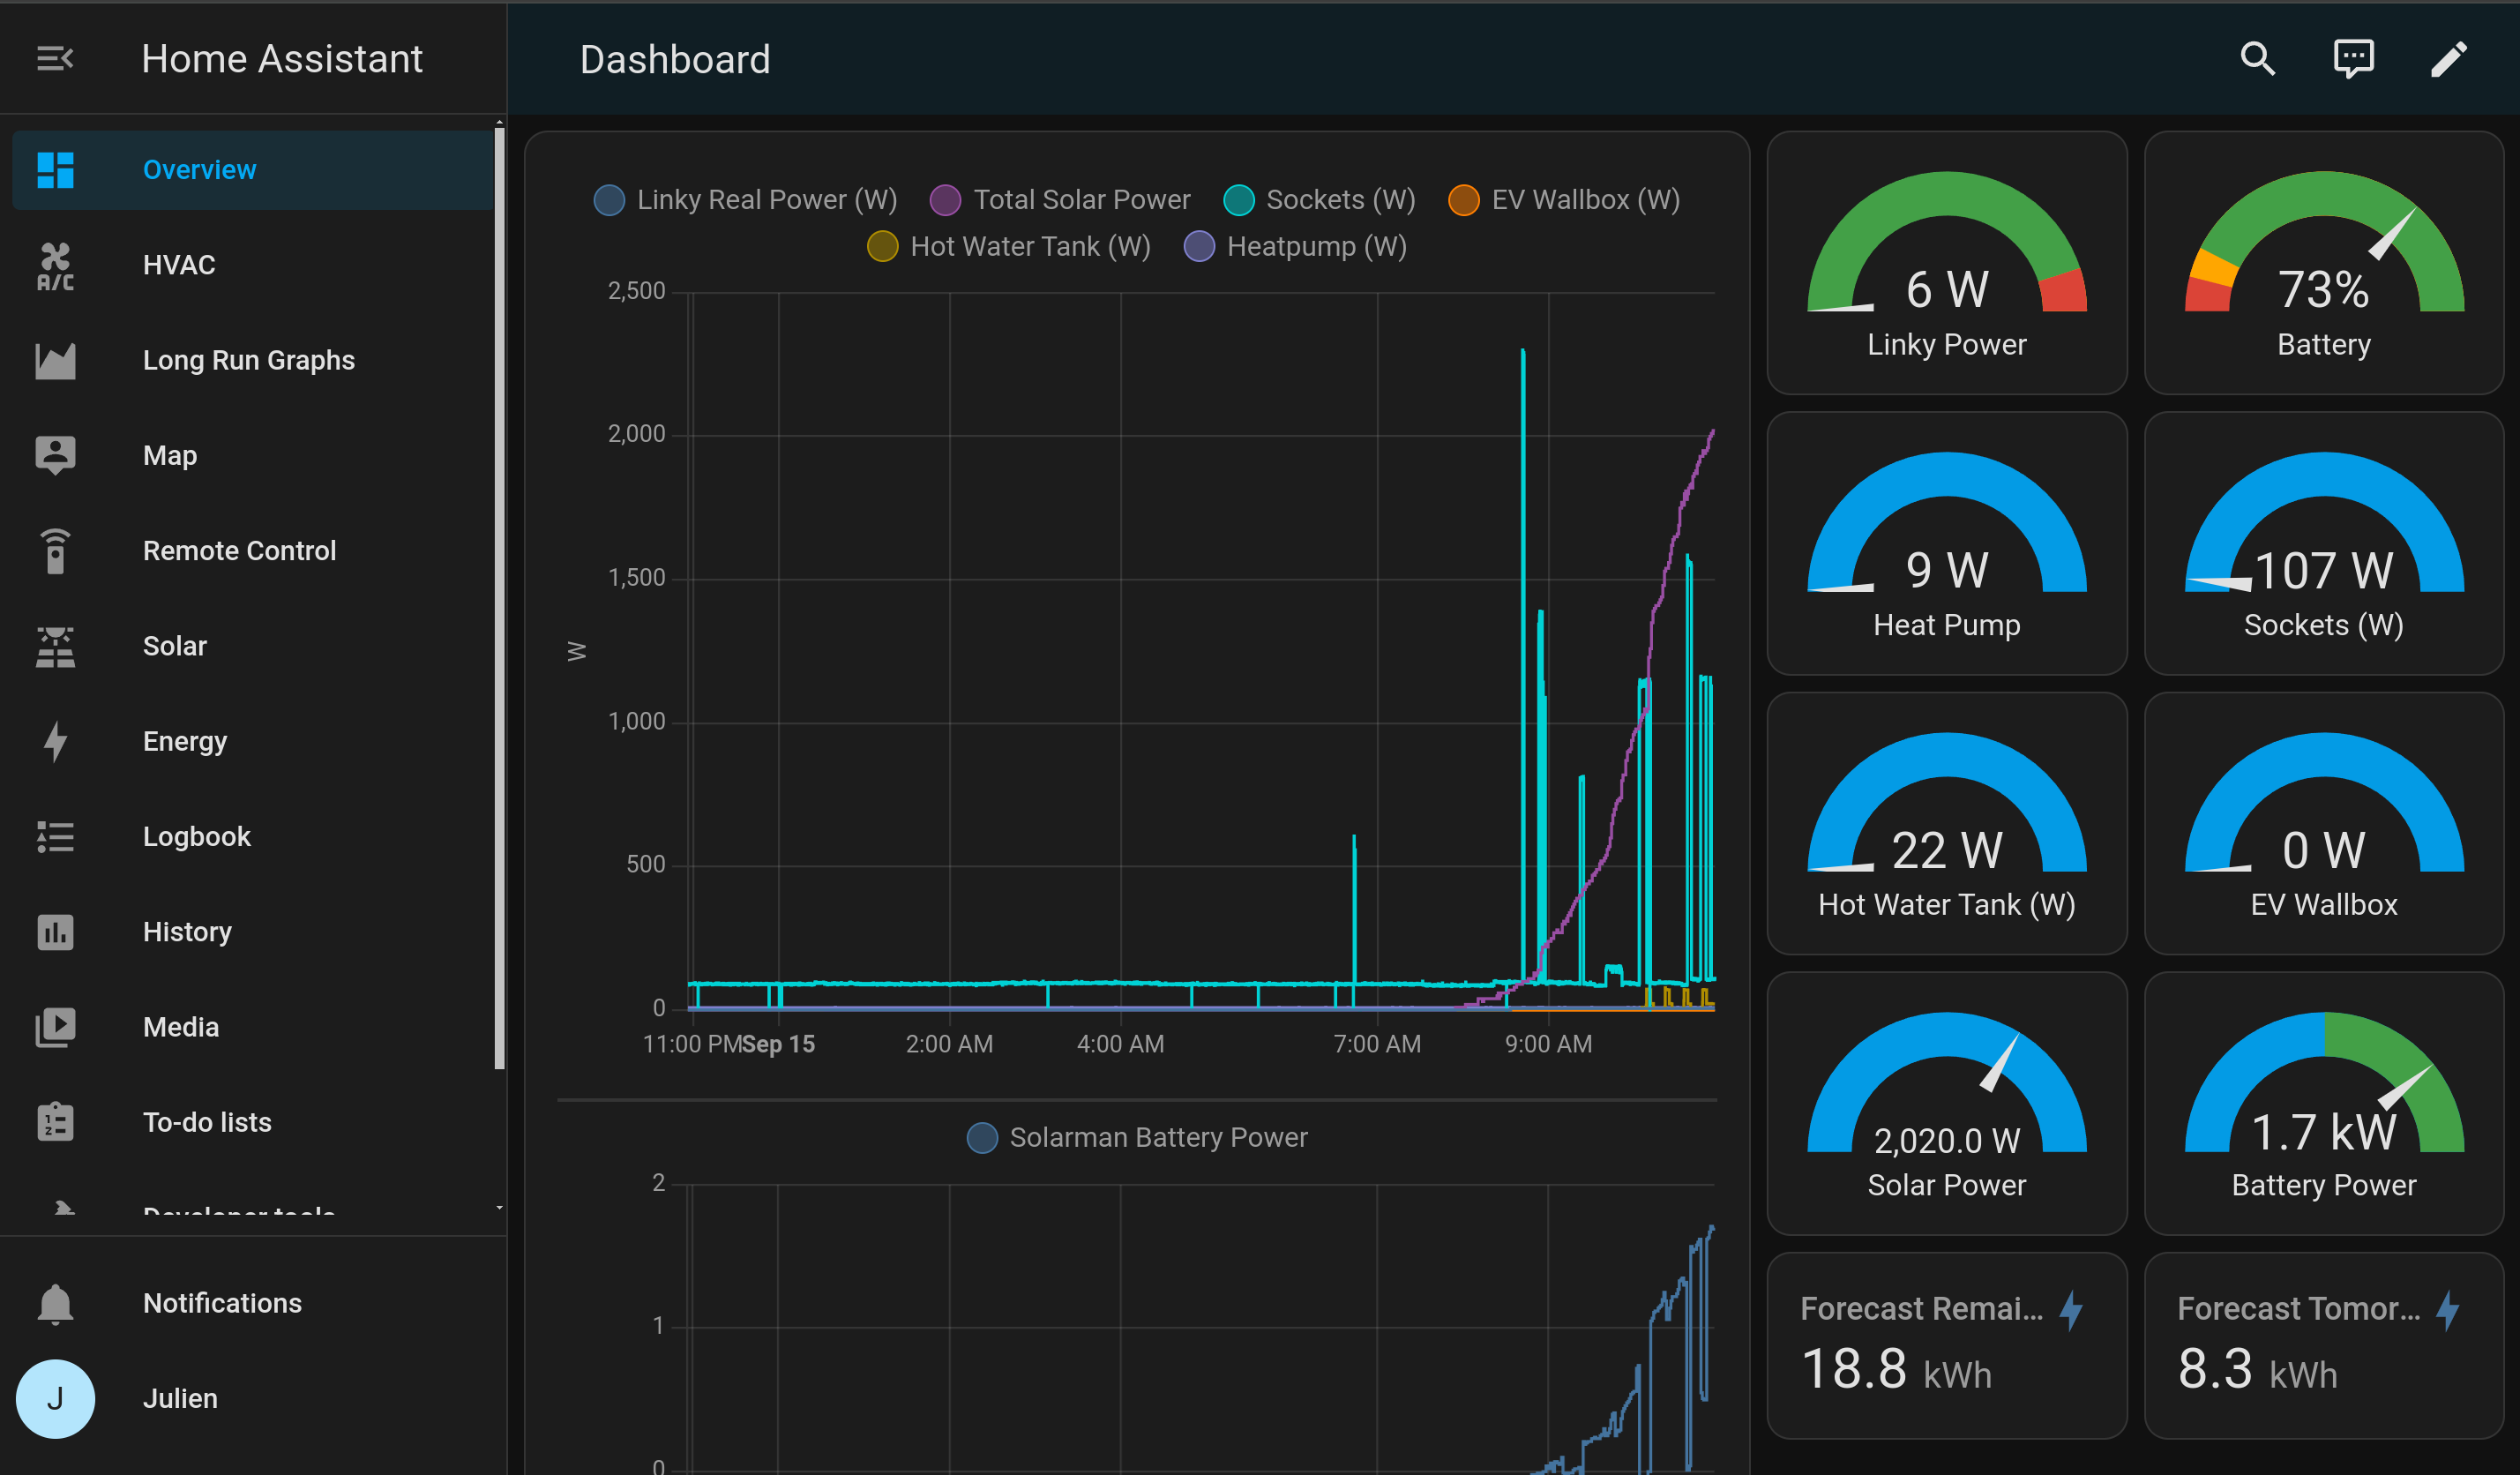
For a long time, I had a HomeAssistant tab open in my browser, typically showing the following custom dashboard.
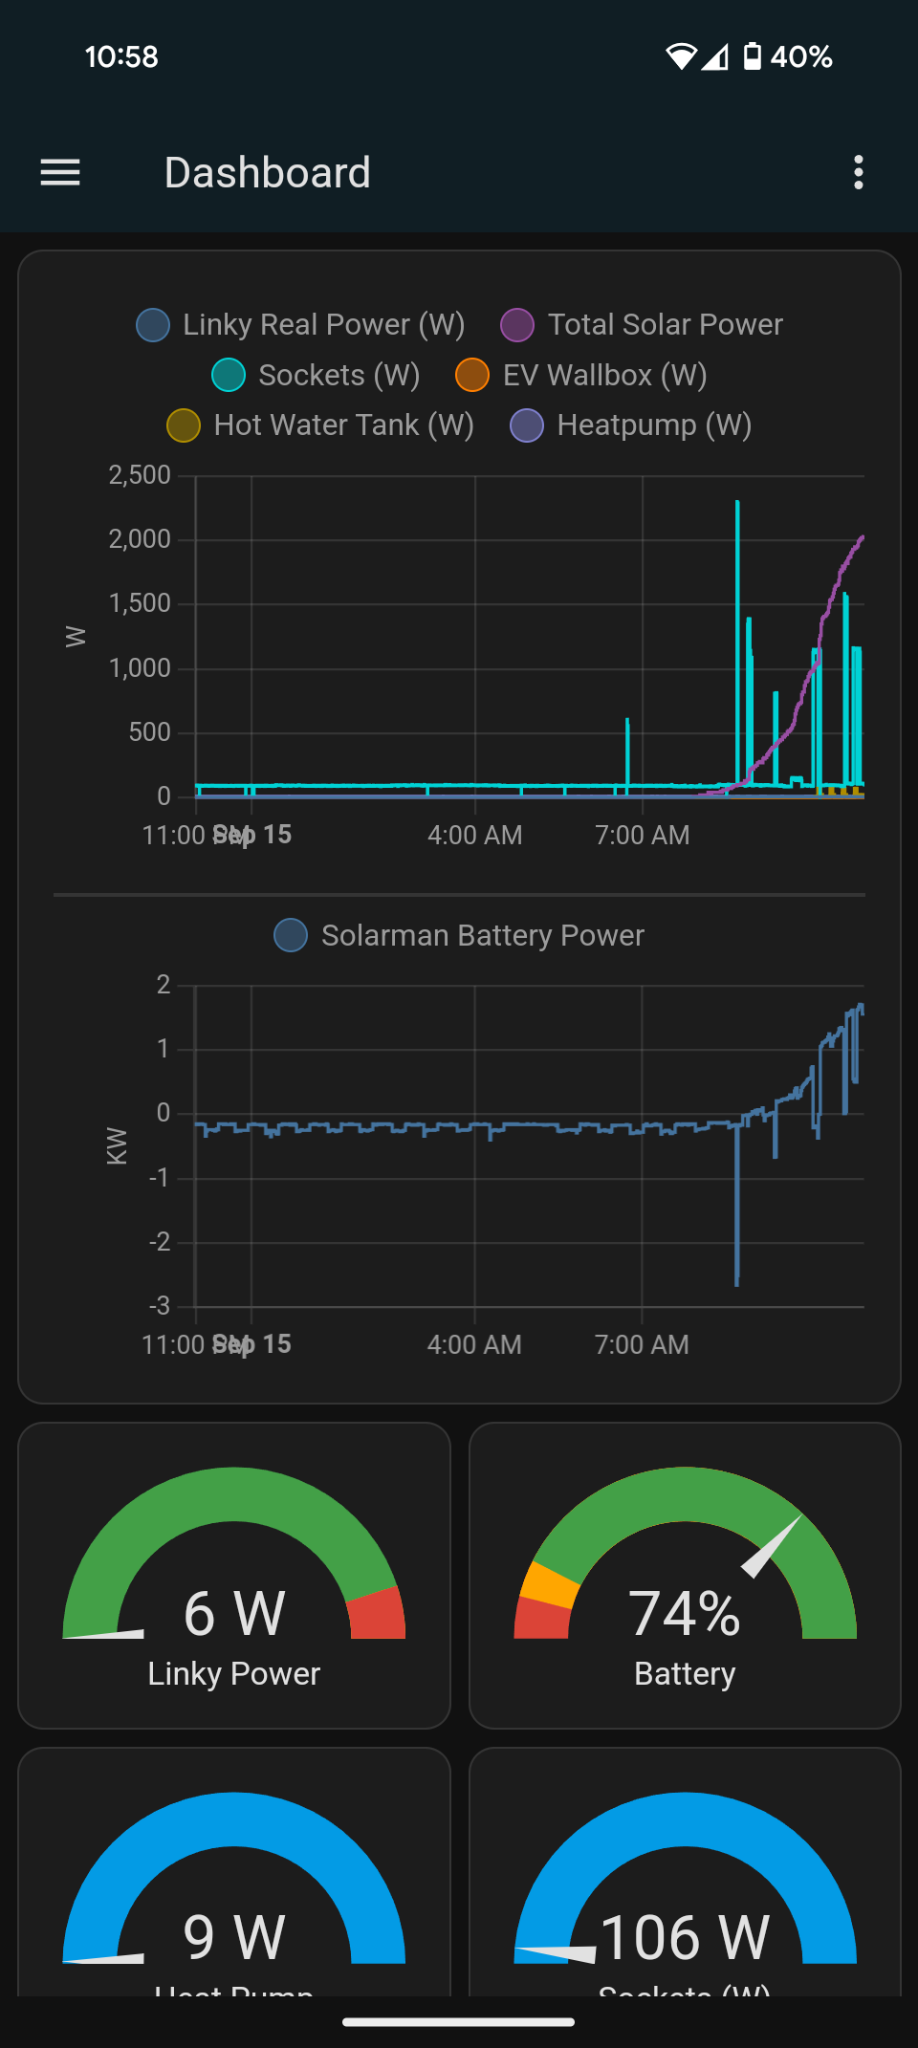
I then installed the Home Assistant app on my Android phone, which also works great.
And finally I discovered that HomeAssistant had a WatchOS companion app, being able to provide "complications" to watch faces. So I purchased a Pixel Watch 2 specifically to display key metrics of the house.
Since I had this watch and those metrics on the wrist, I almost never have to check using a browser or dedicated app. I'm not much of a IoT (internet of shit) person, but this one is a quality of life improvement.
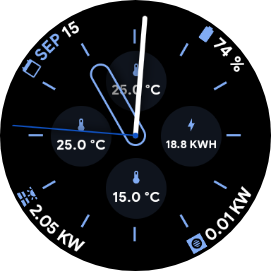
Bottom left : instantenous solar power (reporter by Sofar inverter to HA)
Bottom right : instantaneous heat pump power (reported by a Zigbee sensor)
Top right : current solar batteries SoC (reported by Sofar inverter to HA)
Top center : temperature the house's 3rd floor (reported by Daikin's cassette in wifi to HA)
Left center : temperature in the house's 2nd floor (reported by Daikin's cassette in wifi to HA)
Bottom center : sheltered outdoor temperature (reported by Daikin's outdoor unit in wifi to HA)
Right center : predicted remaining solar production for the day (reported by a prediction API to HA)
It could be even nicer whith gauges-type complications, but that would require HA specifying a minimum and maximum value for each sensor, which it currently isn't able to do/supported. I'm contemplating adding this feature and doing a PR but with a young baby to take care of there is very little free time outside of the office.
Hopefully this article will get completed with much more details regarding how all this works, how the battery cycles, what a rainy day looks like, what a winter day looks like and so on. I have tons of interesting measurments to share.
November 2024 Update
I managed to get new solar panels installed instead of the 6x400W that were laying flat on the grass. I went with 450W / 144 cells, since I cannot fit more than 4 panels (without too much messing around) on the main roof. This was has a much steeper inclination that the small roof.

The gain in winter is considerable, due to being on the roof of course, and also due to the fairly steep inclination towards the south. During the very shortest day of the year and given a perfectly sunny day, it's just enough to go from 20 to 100% battery SoC. This is enough to power the heatpump down to about 5°C, until the next sunrise.
So all-in-all, a fairly well sized system.
Current setup is :
- 4x 435W Trina Solar
- 4x 450W Trina Solar