2024 Energy Restrospective
Notable events
- May 9th, a first batch of 4 solar panel where installed on the first roof (instead of the floor)
- October 25th, a second batch of 4 solar panels where installed on the second roof (instead of the floor)
- During winter 2023-2024 I used the heatpump of the car. For 2024-2025, I stopped heating the car unless defrosting is necessary.
Overall solar production
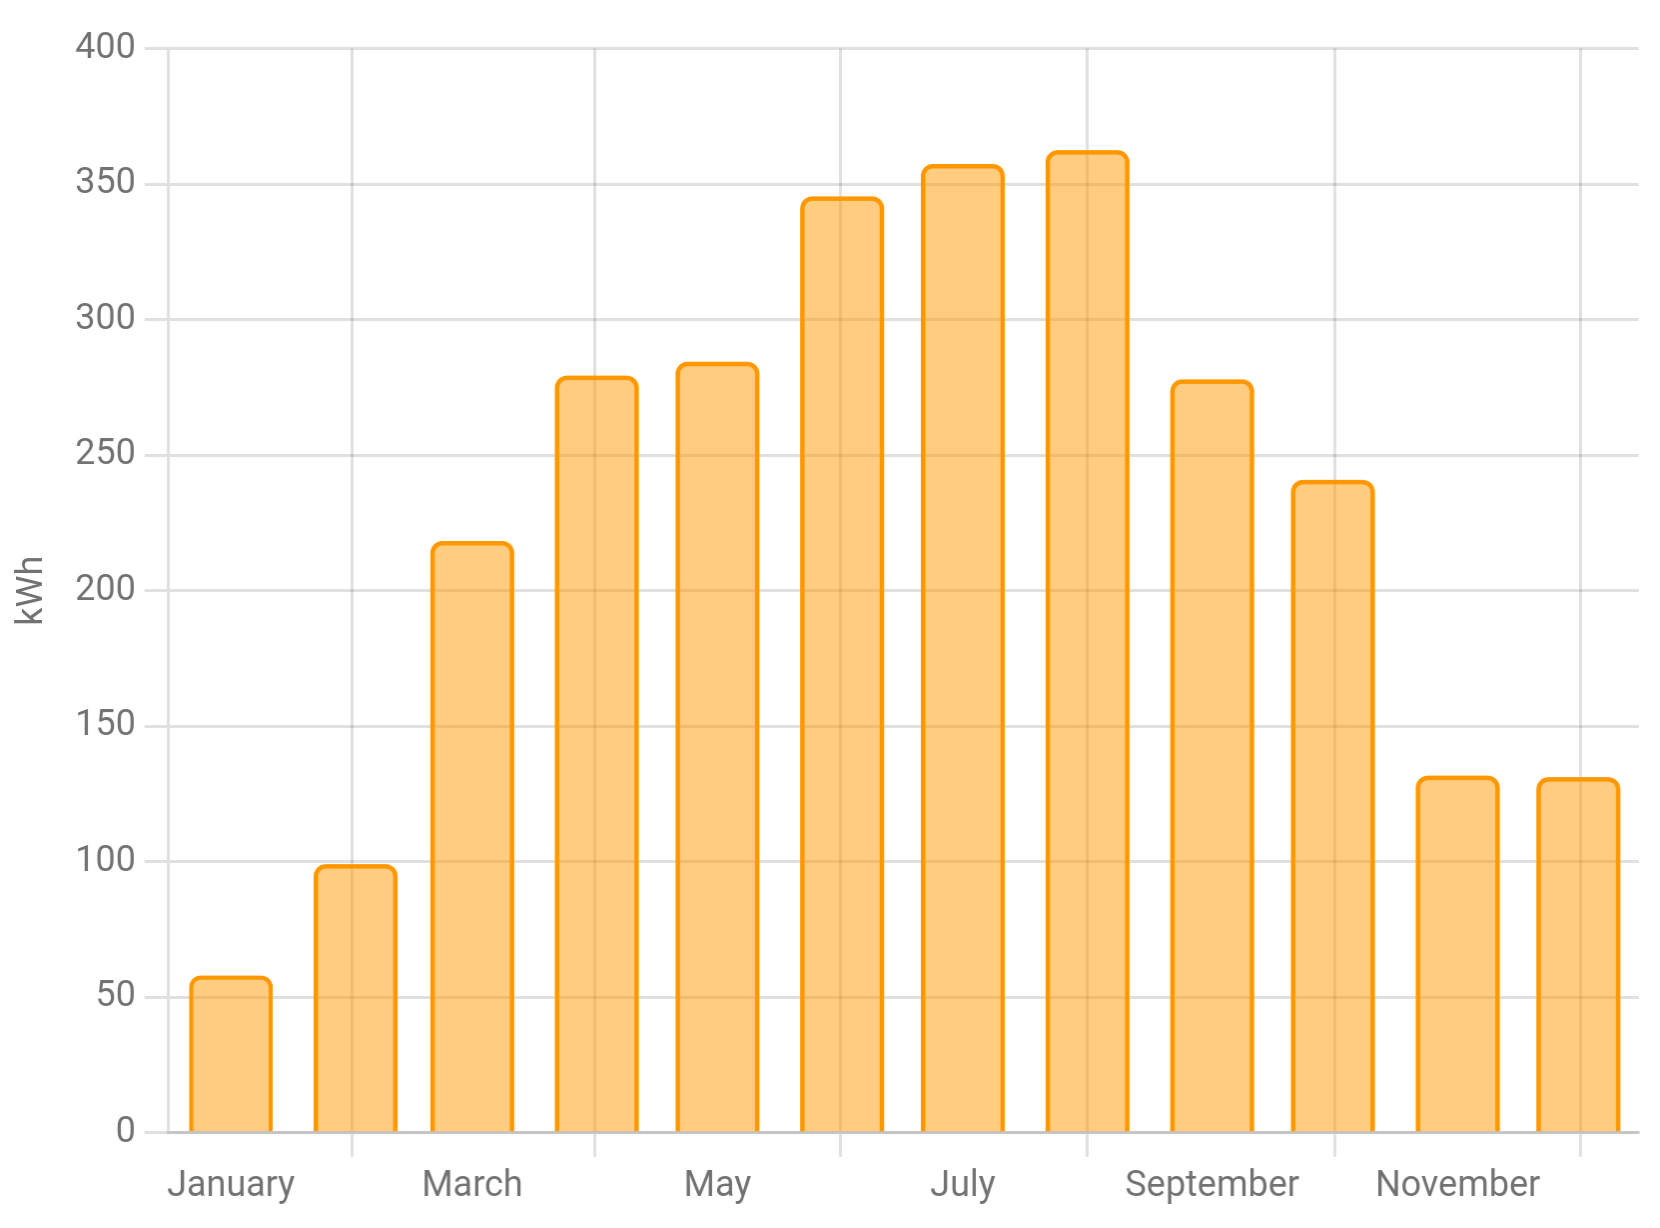
Installation of the first batch of solar panel on the roof increased production drastically, as these were previously in the shade most of the day. The installation of the second batch allows for production even during the shortest day of the year, as long as there is some sunshine.
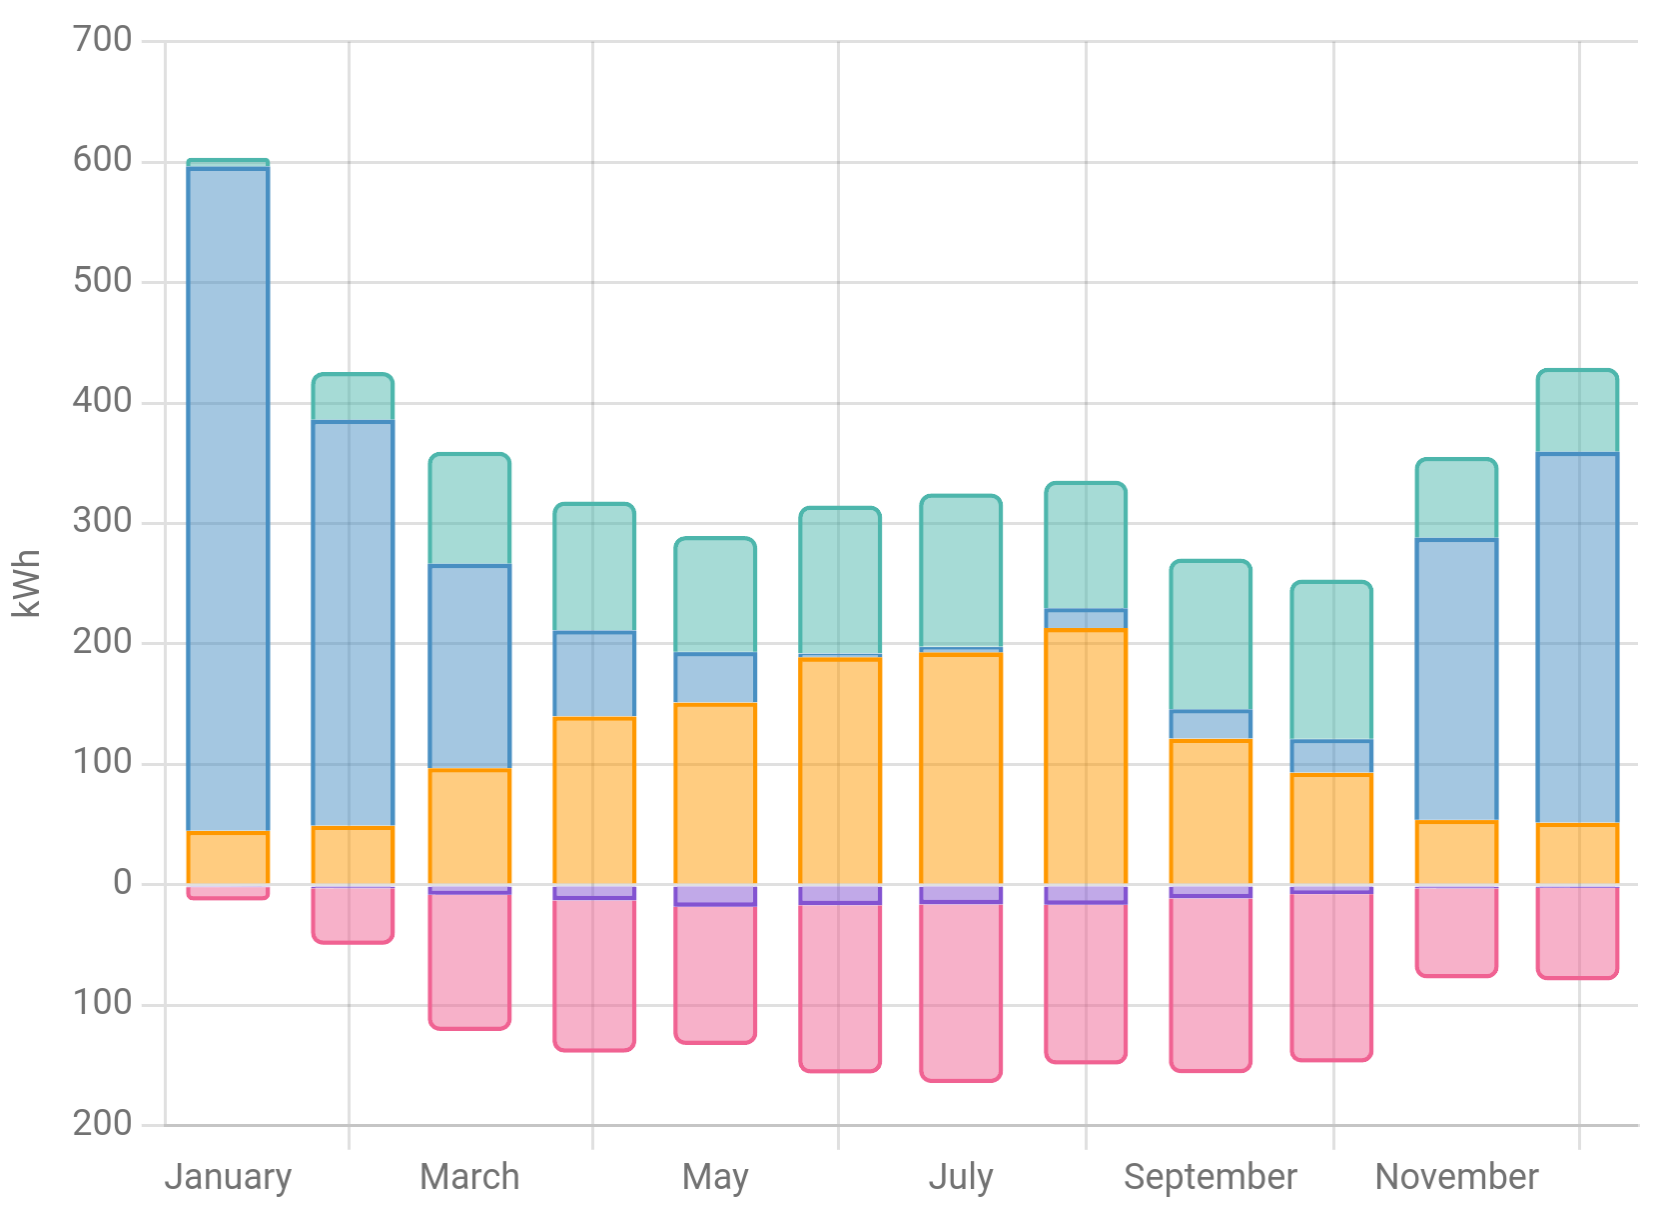
We saw an extremely brutal switch from almost self-sufficiency in October to almost full dependencing during November. The solar production halved, and heating immediately began being necessary. This is not typical and was due to a sudent metorological change.
Key numbers
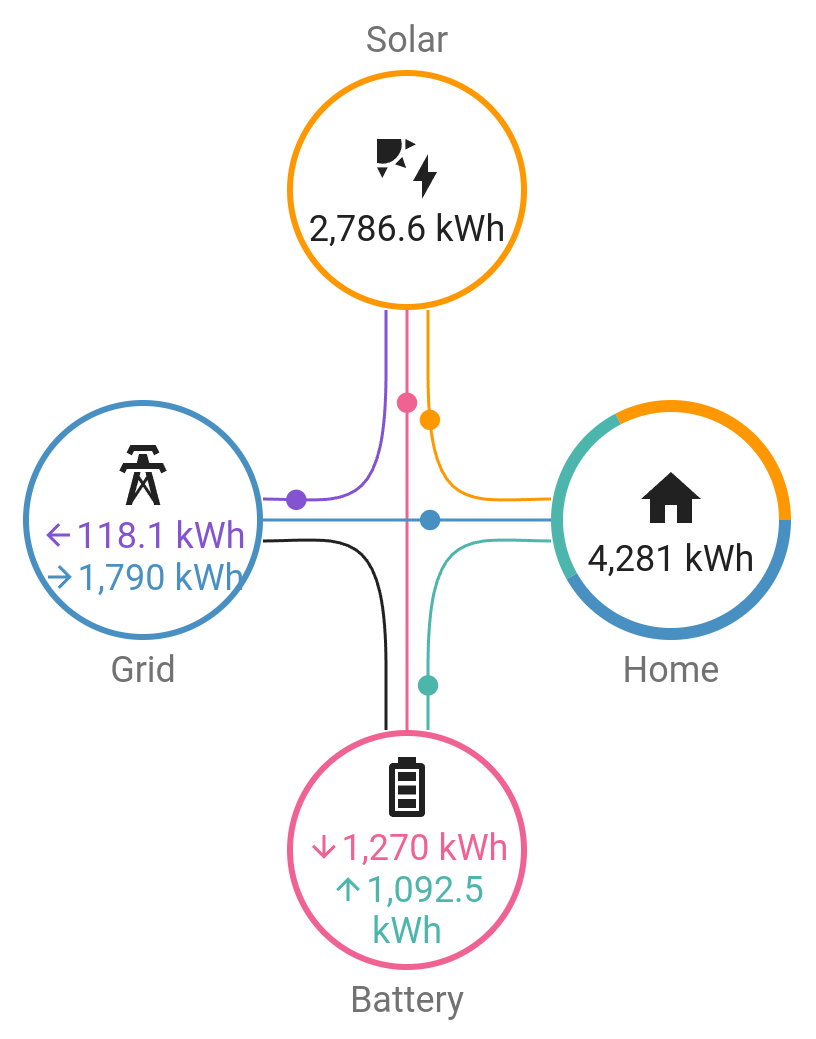
- 4 280 kWh (4.3MWh) consummed.
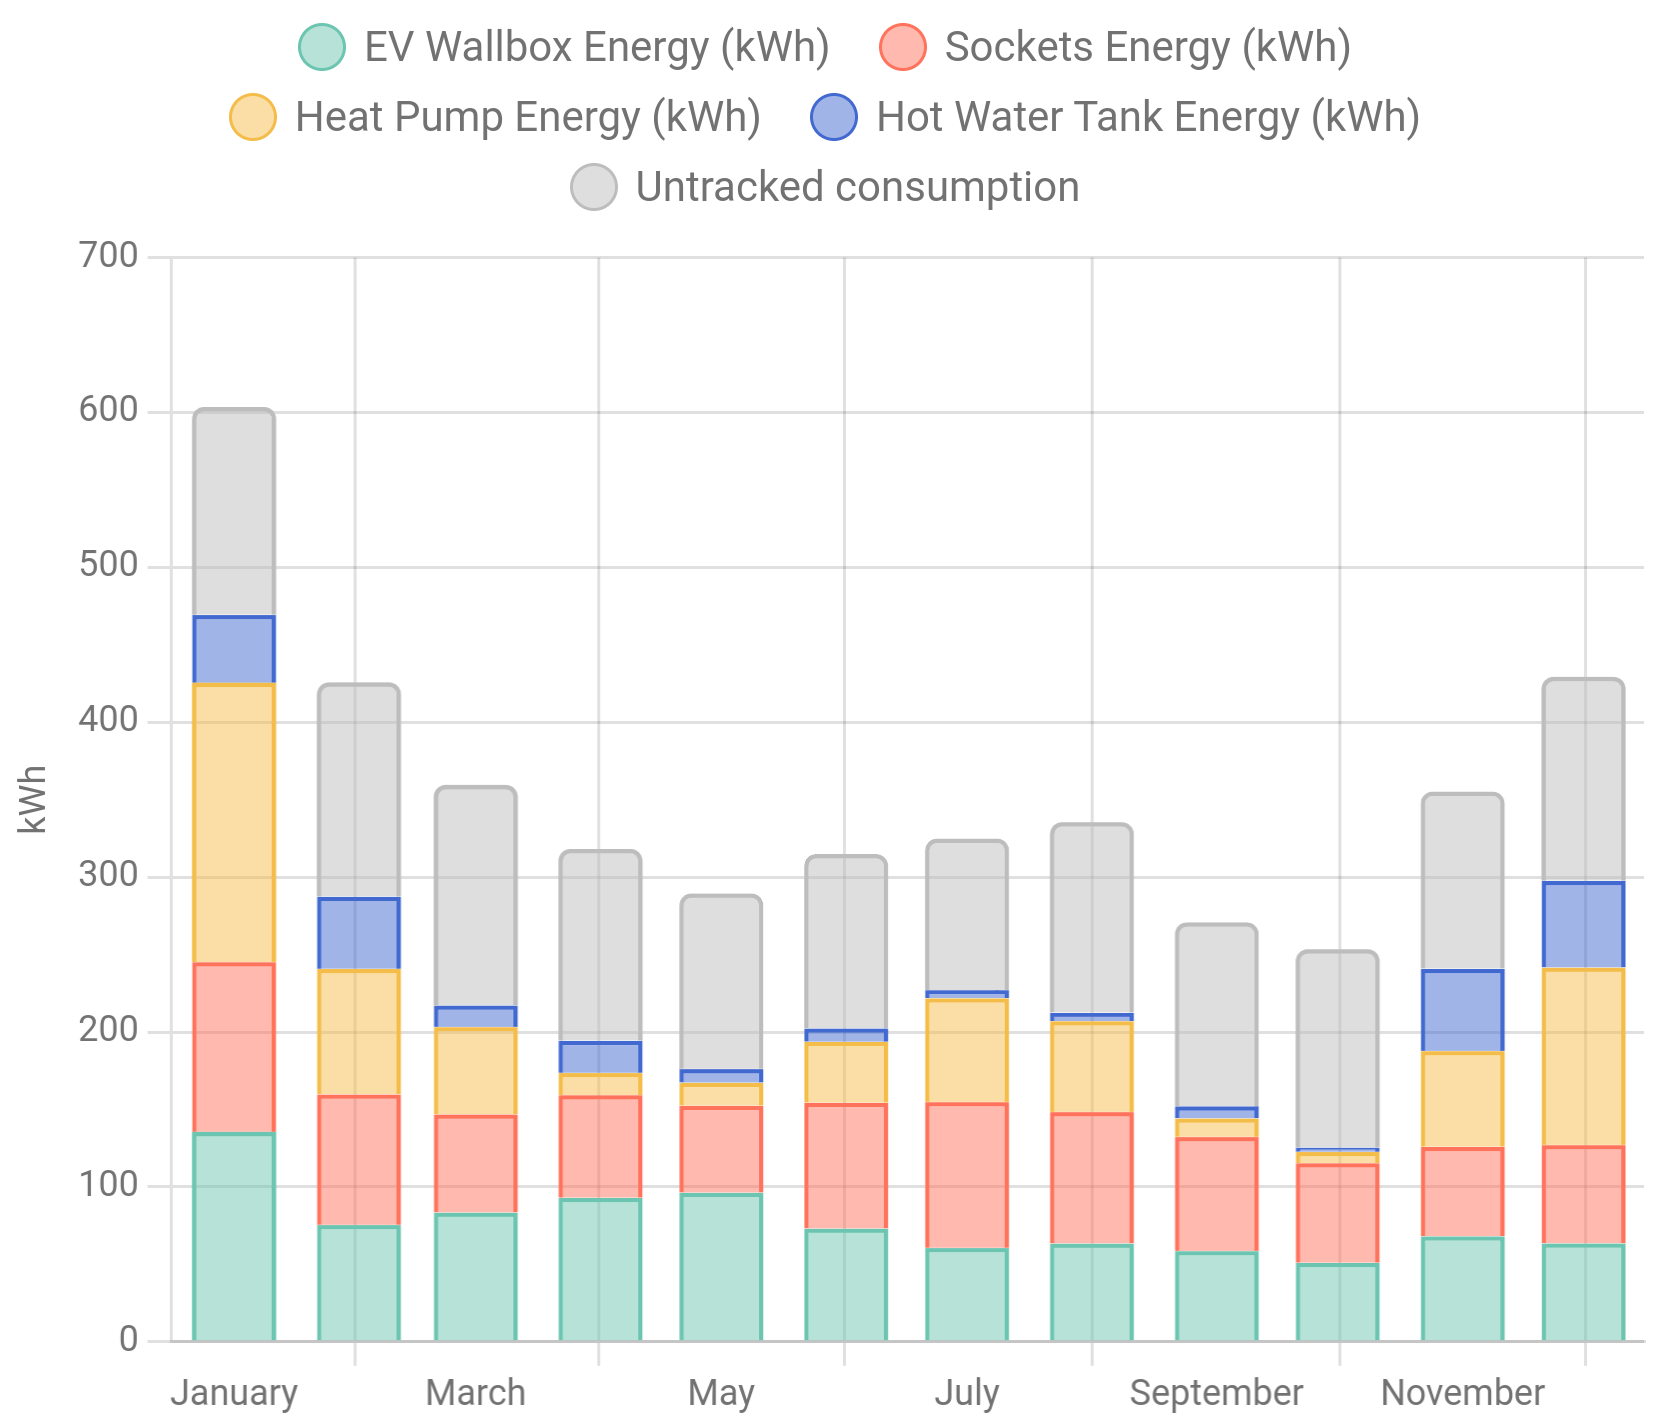
- 912 kWh (0.9MWh) by the car/wallbox.
- 900 kWh (0.9MWh) by the sockets of the house.
- 274 kWh (0.3MWh) by the hot water tank.
- 707 kWh (0.7MWh) by the heatpump.
- 507 kWh (0.5MWh) for heating
- 200 kWh (0.2MWh) for cooling
- 2 787 kWh (2.8MWh) produced.
- 1 279 kWh (1.3MWh) injected in the batteries.
- 1 093 kWh (1.1MWh) recovered from the batteries.
- 1 789 kWh (1.8MWh) drawn from the grid.
- 118 kWh (0.1MWh) accidentally re-injected in the grid.
- 85.5% of charge/discharge efficiency.
- 58% overall self-sufficiency (90%+ from May to October, 100% in June and July).
- 24 kWh maximum daily production during the longest day of the year.
- 10 kWh maximum daily production during the shortest day of the year.


Hot water production
The water tank consummed 274 kWh (69€ subscription excluded).
As a reminder, it uses a 20~70W fluid circulation pump with two large thermal solar panels and a 2.6kW backup resistive element.

Considering 2.7 kWh of daily consumption without solar panels (roughly 1 000 kWh yearly), we deduce that the thermal solar panels have avoided about 720 kWh (a 4x energy savings). This is not quite accurate though, as in summer we use the excess hot water to directly feed the washing machine (30 to 40°C). This is thermal energy that would otherwise have to come from electricity. Therefore we are in a 4x+ energy saving situation.
Heating
Last winter I was quite conservative with the set temperatures. This winter I'm allowing 21° and even 22° for brief periods in the living room.


The heating needs are getting clearer.
- > 12°C, no actual need to heat the house
- 8~12°C, heating for 1h in the morning, and 1h30 hours in the evening.
- < 8°, we need to keep a 18°C indoor set temperature to maintain the night temperature and allow for a quick recovery (< 45 minutes) to 21°C in the morning.
Here are some datapoints for different days :
- 12° : 70W daily average (November 28th)
- 8°C : 150W daily average (December 9th)
- 4°C : 300W daily average (December 13th)
- 4°C : 325W daily average (December 29th)
You can take a look at the sizing of the heatpump where I initialy projected a 1.5kW of thermal requirement at 4°C. Given a 3.5 COP (1.2kW) of the heatpump at such temperatures, this is not too far off. There is a ~23% load factor on the heatpump at that temperature, plenty of margin to use it for short heating burst and to handle much lower temperatures.

The heatpump consummed 507 kWh to heat the house (127€ subscription excluded).
Air conditionning
This was our first year using air conditionning.
The heatpump consummed 200 kWh to cool the house. None of which was drawn from the grid, due to excess solar production in summer.
EV car
I only recently plugged the car's statistics into home assistant, so I cannot provide km yet. But given an average consumption of about 18kWh/100km (the car is not efficient) and the 912 kWh delivered by the wallbox, we can estimate about 5000 km of range charged by the wallbox. The real value is probably closer to 10 000 km, but half of it is being charged at the destination.

The wallbox consummed 912 kWh (all of it being covered by solar production during 6 months of the year, so roughly 115€). This brings the cost per 100 km to 2.3€.
At 1.75€ per liter of SP95, this is equivalent to a car that would consume 1.3L/100km.
EDF (electricity provider) bill
During June to October, we are pretty much only paying for the subscription fee (15.9€ + taxes for a 9kVA subscription).

Below is our actual billing from the provider. This is our only utility bill, as electricity covers our needs for heating, cooking and transportation.

Fun fact, our yearly consumption from the grid can be produced in 5 seconds by the average French nuclear reactor (considering 1.8 MWh of consumption and a 1300 MWe P4 reactor).
Humbling observation
Having batteries does make us better citizens as we don't force EDF to absorb our solar production when they don't want/need it. And at the very least it removes our evening demand if not all of the demand. On that topic, I regret that our solar inverter doesn't have a "peak shaving" mode, allowing to draw say 500W from the grid, but handling higher peaks from the batteries.
Seasonality is huge. We are becomming extremely seasonal consummers and I doubt this is a viable model at scale for the grid operator. I have calculated that even tripling the surface of solar panels wouldn't make a dent in the energy drawn from the grid in winter. Windmills seem to be a dead-end for us too as we live in the city.
